
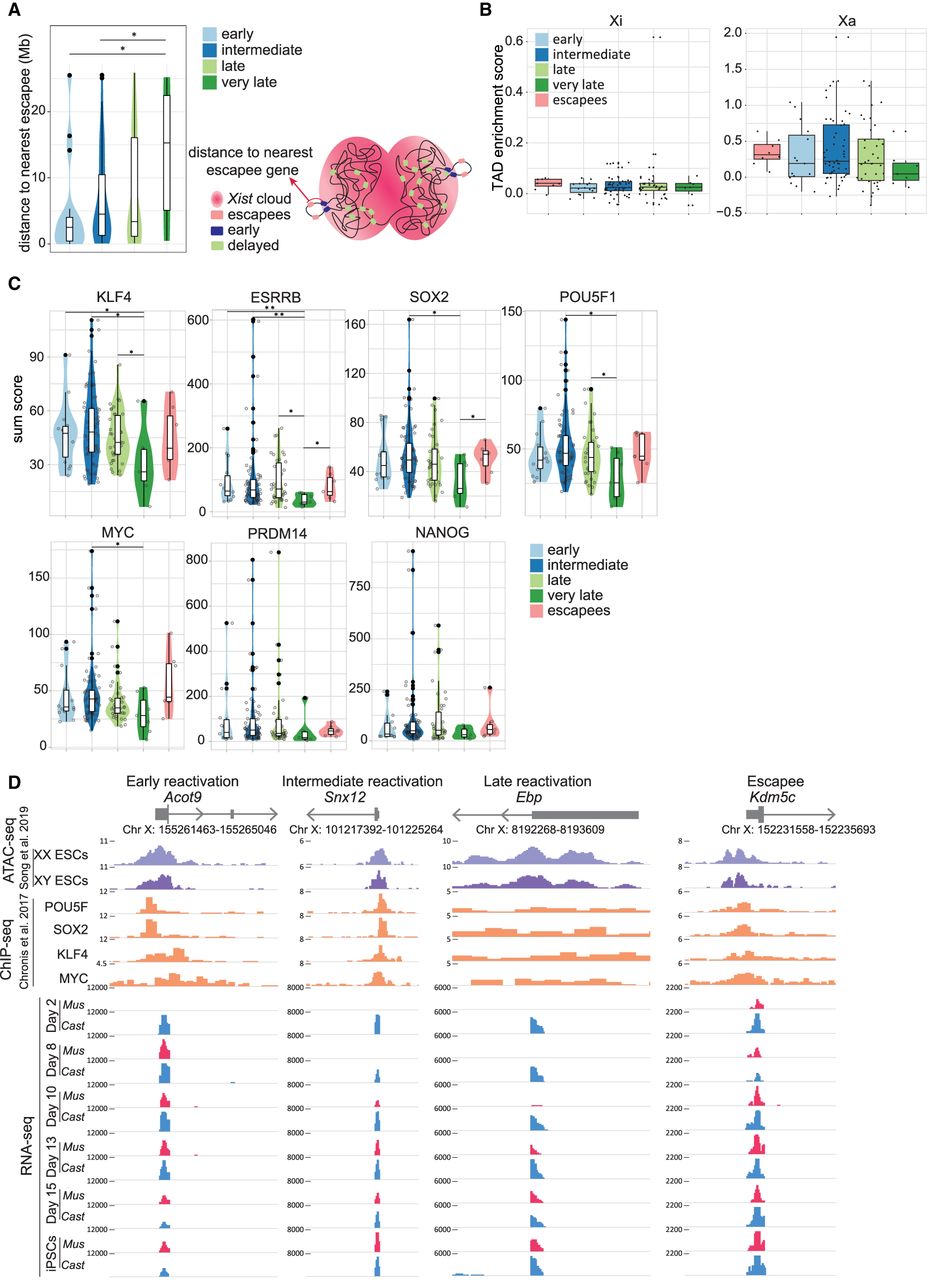
Link between genomic and epigenomic features and XCR kinetics. (A) Violin diagram with the distance to nearest escapee (Mb) for each reactivation class (left). Schematic figure of distance to nearest escapee gene (right). The significant P-values of a Wilcoxon rank-sum test comparing the different gene reactivation classes are indicated with asterisks above the violin plots: (**) P-value = 0.001–0.01; (*) P-value = 0.01–0.05 = significant; (not significant) P-value ≥ 0.05. (B) TAD enrichment scores (with Z-score of contacts; see Methods) for genes from each reactivation class on the inactive X Chromosome (left) and active X Chromosome (right). (C) Violin plots indicating the sum score of enrichment levels of POU5F1, SOX2, KLF4, and MYC occupancy for each reactivation class (early, intermediate, late, very late, and escapees). The P-values are calculated as described above. (D) ATAC-seq signal for open chromatin in female and male ESCs; ChIP-seq signal for POU5F1, SOX2, KLF4, and MYC binding in male ESCs; and RNA-seq signal of allele resolution gene expression during reprogramming (blue for RNA-seq signal from Cast origin and red for Mus origin) for a representative gene corresponding to each reactivation class (early, intermediate, late, and escapee).


