
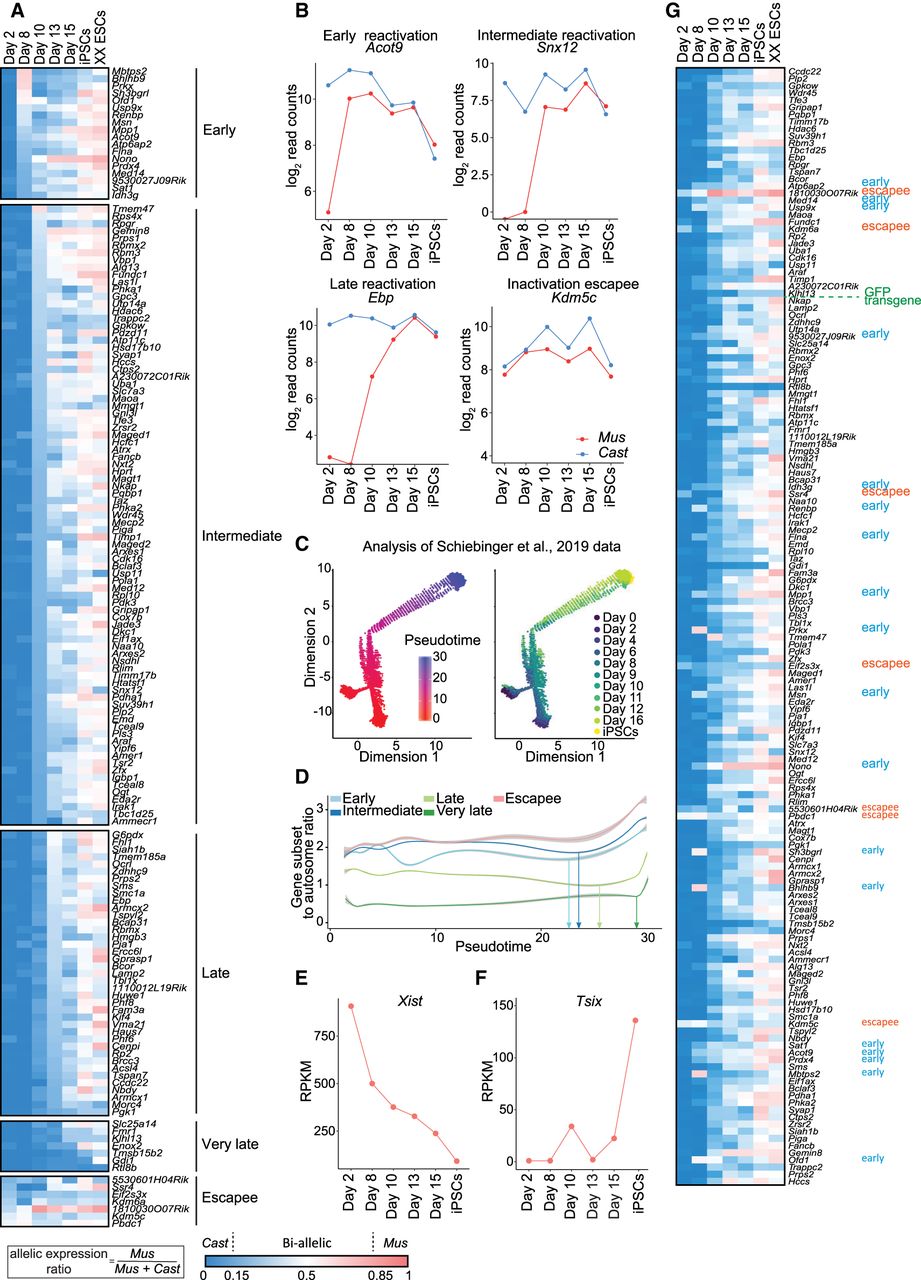
Different X-linked genes reactivate with different kinetics during factor-induced reprogramming to iPSCs. (A) X-linked genes ordered by reactivation timing at different time points of reprogramming within days 2 to 15 and in iPSCs and ESCs. Ratios were calculated by dividing maternal by total reads (Mus/Mus + Cast). The color gradient represents the parental origin of allelic expression, with Cast expression in blue (ratio < 0.15), Mus expression in red (ratio > 0.85), and a biallelic expression range of 0.15–0.85. Number of informative genes = 156. Genes were considered early if expressed biallelically at day 8, intermediate at day 10, late at day 13, very late at day 15, and escapees at day 2. (B) Gene expression levels (log2-transformed read counts) of representative X-linked genes for each reactivation class (early, intermediate, late, and escapee) during reprogramming. Parental origin of the allelic expression is indicated in blue for paternal origin (Cast) and in red for maternal origin (Mus). (C) Single-cell ordering along the inferred pseudotime trajectory constructed using Monocle. (Left) Single cells colored by the pseudotime; (right) single cells colored by the original collection timepoint. (D) Mean expression ratio of genes from different reactivation classes to autosomes as a function of pseudotime. The curve was derived using generalized additive model. (E) Xist expression levels (exon-to-intron ratio in reads per kilobase per million [RPKM]; see Methods) during reprogramming. (F) Tsix expression levels (exon to intron ratio RPKM, see methods) during reprogramming. (G) Gene reactivation kinetics ordered by genomic location of genes on the X Chromosome. Ratios were calculated as described in A.


