
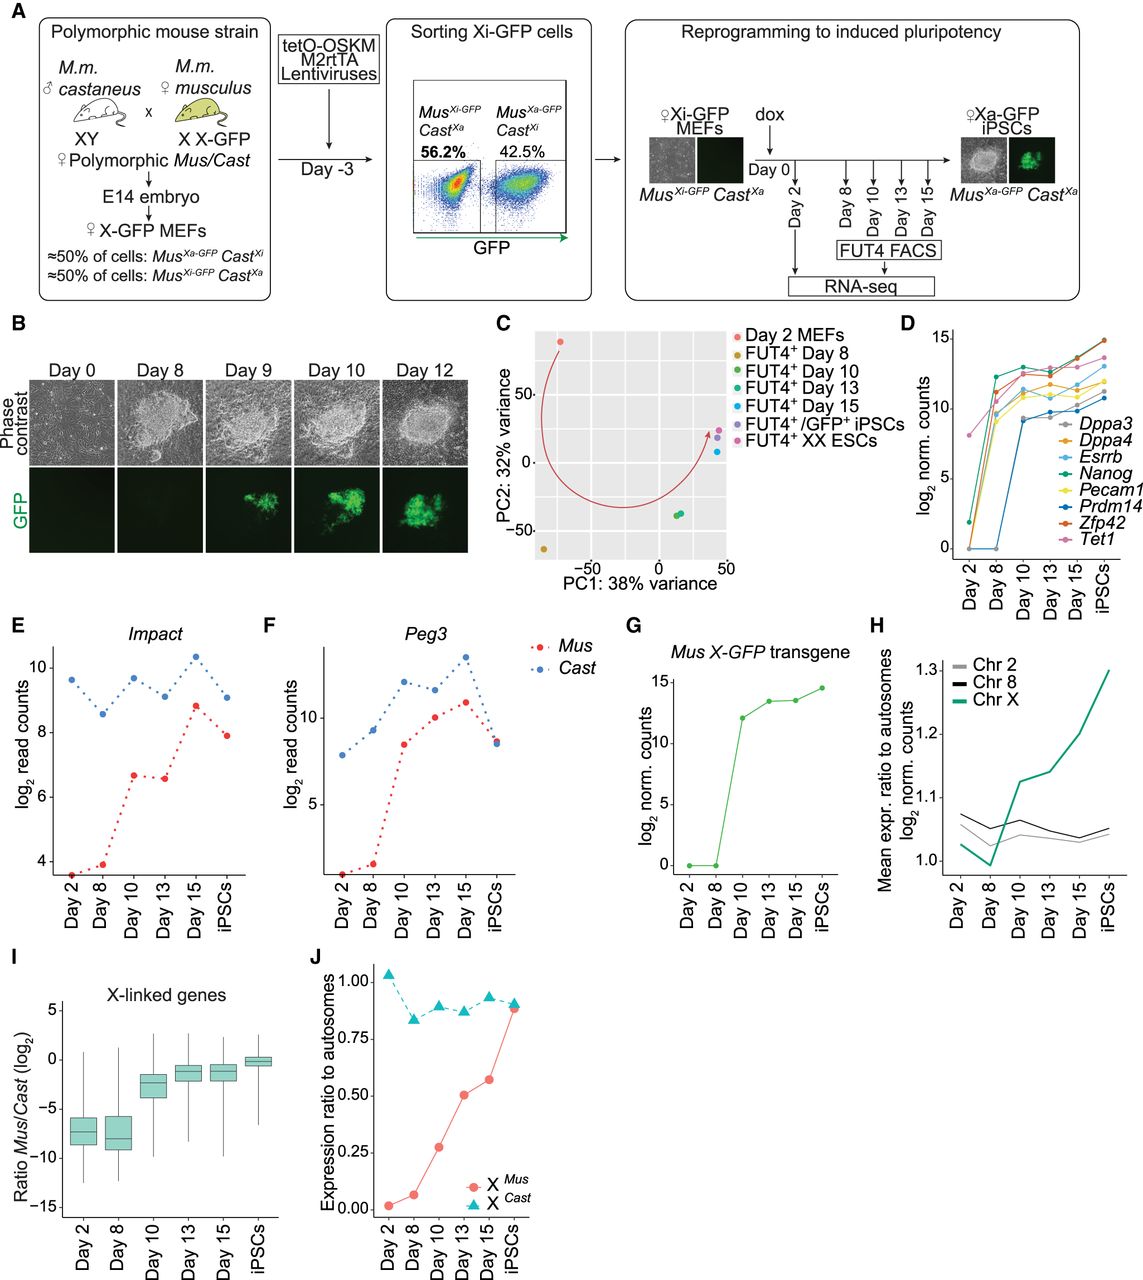
Allele-resolution system to study transcriptional reactivation of X-linked genes during reprogramming to pluripotency. (A) Schematic representation of the system used to trace XCR during reprogramming. (M2rtTA) Reverse tetracycline transactivator. (B) Phase contrast and fluorescent images of representative stages of reprogramming from day 0 to day 12, starting from female MusXi-GFP/CastXa MEFs to MusXa-GFP/CastXa iPSCs. GFP+ cells are increasing in number as a result of XCR. (C) Principal component analysis (PCA) of gene expression from different stages of reprogramming. Each colored dot represents a different time point: day 2 (orange), 8 (dark yellow), 10 (green), 13 (turquoise), 15 (blue), FUT4+/GFP+ iPSCs after four passages (purple), and female ESCs (pink). (D) Levels of pluripotency network gene expression (log2-transformed normalized read counts) during the time course of reprogramming. (E) Expression levels of Impact, an autosomal, paternally imprinted gene during factor-induced reprogramming. (F) As in E for Peg3. (G) X-GFP transgene expression during reprogramming (log2-transformed normalized read counts). (H) Mean expression ratio of Chromosome 2, 8, and X relative to autosomes (log2 normalized counts) during reprogramming. (I) X-linked genes expression ratio Mus/Cast (log2-transformed normalized read counts). See Methods. (J) Mean expression ratio of the MusXi allele (red) and CastXa allele to autosomes during reprogramming.


