
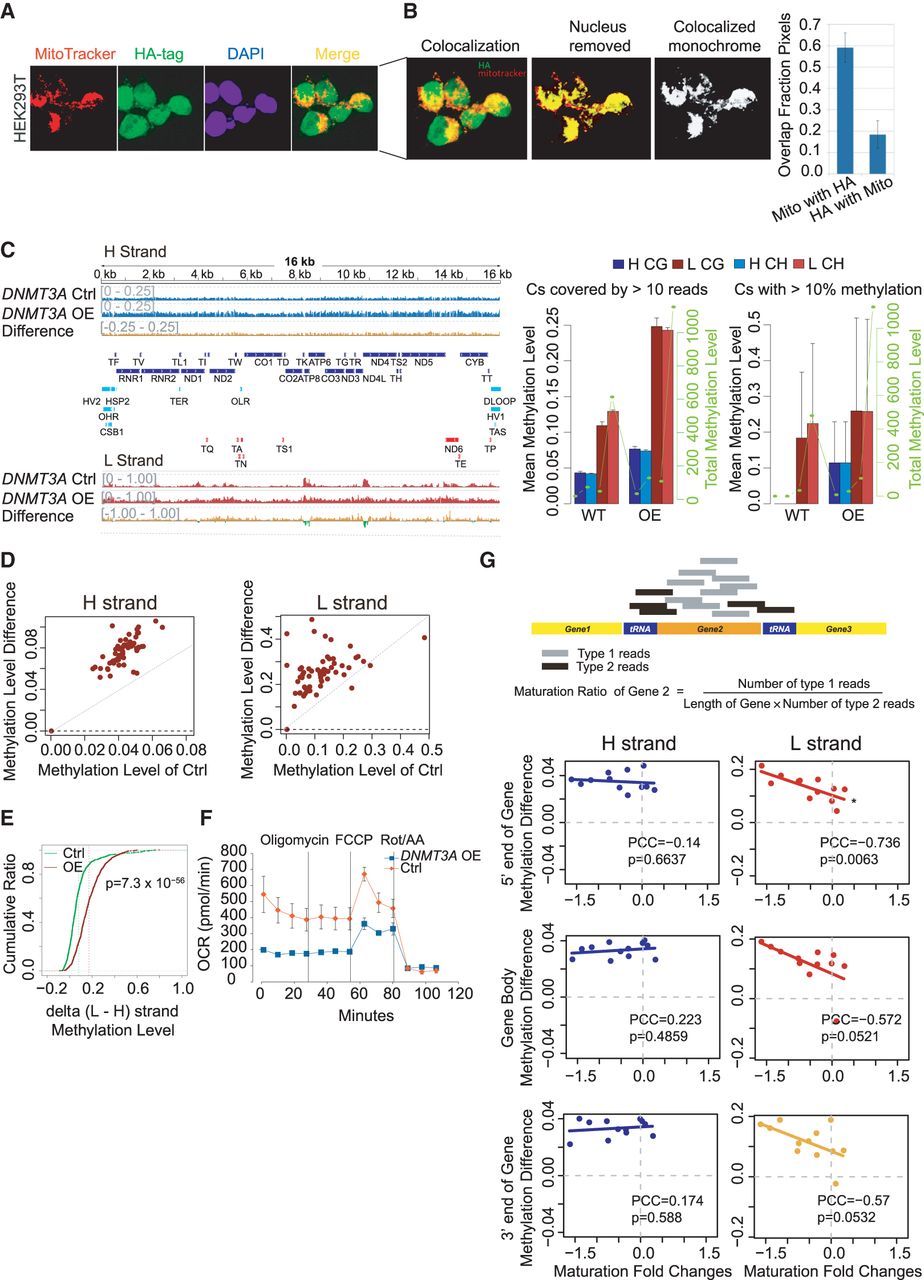
Presence of DNMT3A in mitochondria and effects of DNMT3A overexpression on mtDNA methylation and transcript processing. (A) Immunofluorescence staining of HA-tagged DNMT3A. Cells were exposed to MitoTracker Orange (red) to label mitochondria and anti-HA with DNMT3A-transfected cells (green) and DAPI (blue) to label nuclei. Yellow pixels in the Z-stack composite indicate sections in which DNMT3A colocalized with mitochondria, showing that DNMT3A localized to both nucleus and mitochondria. (B) Overlap of mitochondria fluorescence with DNMT3A-HA-tagged fluorescence among pixels passing a stringent background threshold to remove correlation contributed by background signal. (C, left) mtDNA methylation profiles after DNMT3A overexpression (DNMT3A OE) on the H and L strands. Blue tracks show methylation levels of the H strand (scale from 0 to 0.25) or L strand (scale from 0 to 1), and red (positive) or green (negative) tracks show methylation difference. Annotations and summary statistics are as in Figure 1. (Right) Mean (left y-axis) and total (right y-axis) mtDNA methylation of CG and CHs on the H and L strands, respectively. (D) Scatter plot between the mean methylation level of 63 functional elements of control samples (x-axis) and corresponding DNMT3A OE samples (y-axis, DNMT3A OE) on the H and L strands. (E) Cumulative curve of methylation level difference between L and H strands after sampling 1000 paired Cs under DNMT3A OE. The P-value for the difference between DNMT3A OE and control was calculated with a one-sided t-test. (F) Oxygen consumption of DNMT3A OE with control A549 cells. (G, upper) Graphic illustration of maturation ratio calculation. (Lower) Scatter plot of maturation fold changes (FC) against H- and L-strand methylation difference of 5′ end (±200 bp of TSS), gene body, and 3′ end (±200 bp of TTS) of gene comparing DNMT3A OE with control. (*) Negative PCC with P < 0.01.


