
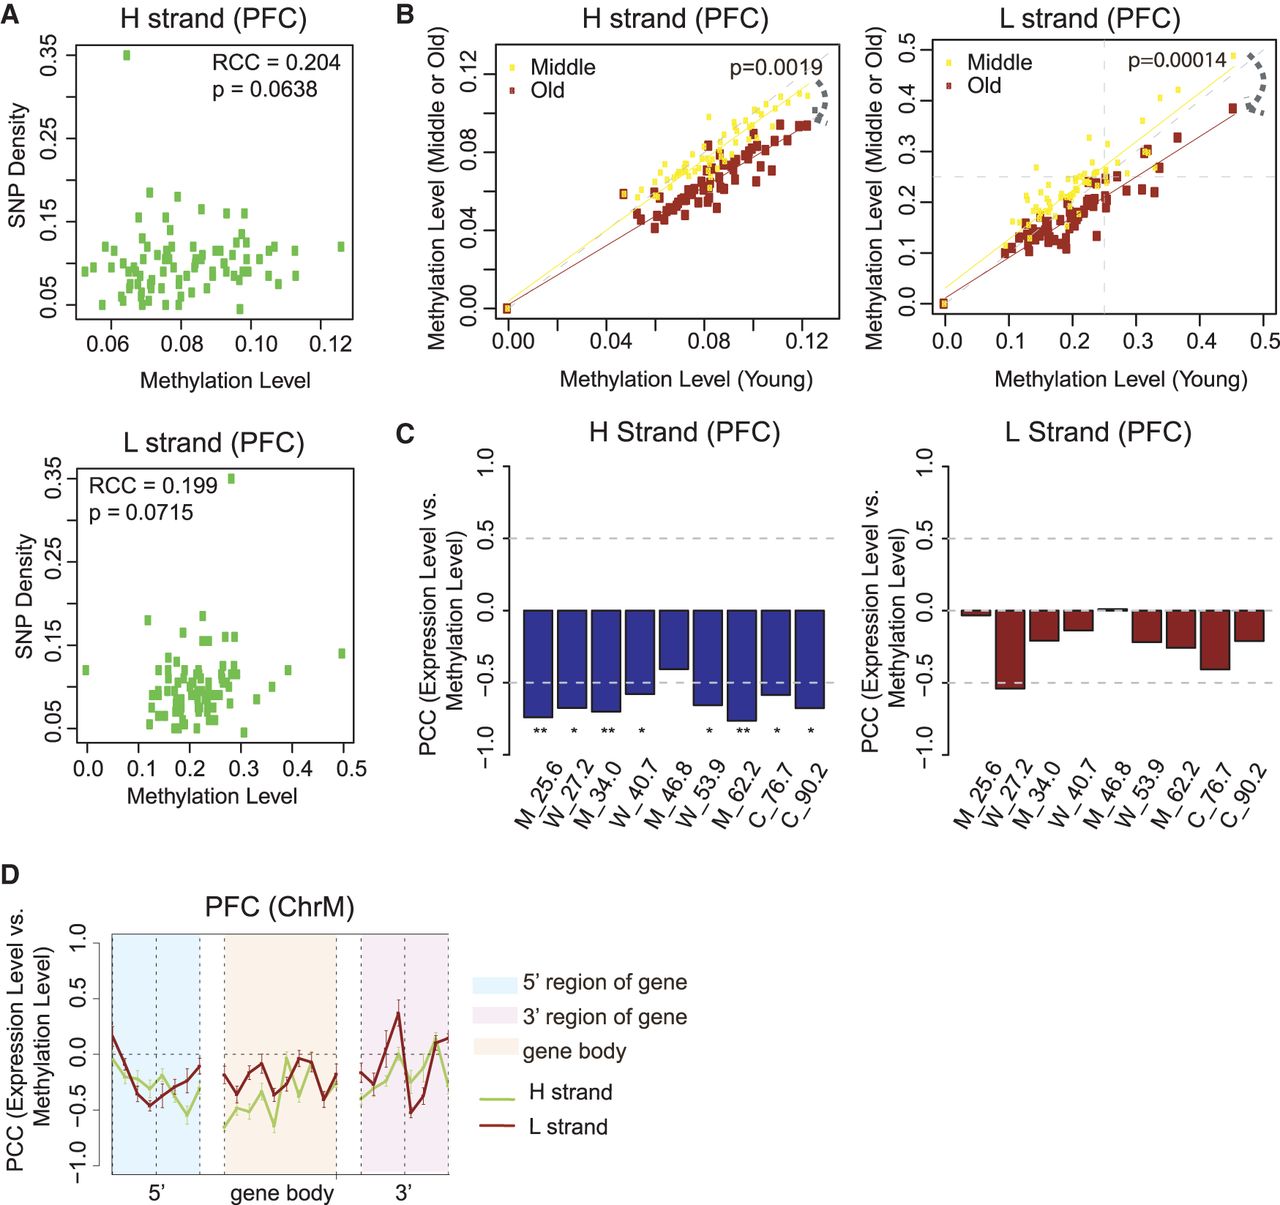
mtDNA methylation is correlated with SNP density, decreases during aging, and is negatively correlated with gene expression. (A) Spearman's rank correlation coefficient (RCC) between mean methylation 200 bp per bin and SNP density on the H and L strands. An SNP data set (SNP142) was downloaded from NCBI. ChrM is binned per 200 bp, and SNP density per bin is defined as the number of SNPs located in that bin divided by length of the bin (200 bp). Subsequently, correlation between SNP density and mean methylation on hPFC samples, per bin, was calculated. (B) Scatter plot of methylation on each of the functional elements annotated in MITOMAP between young and middle (or young and old) age groups on the H and L strands. Human brain samples are separated based on age: young (20–40 yr), middle (40–60 yr), and old (>60 yr). P-value between two lines is calculated based on a one-sided t-test. (C) Correlation between transcript abundance and mean methylation level within each sample on the H and L strand: (*) P < 0.05; (**) P < 0.01. (D) Correlation between transcript abundance and methylation within the sample (across genes) in the 5′ region, gene body, and 3′ region of H-coded genes in human PFC in 50-bp windows. The gene 5′ and 3′ regions are defined as the ±200 bp at the 5′ and 3′ end of genes except MT-ATP6, which overlapped with both MT-ATP8 and MT-CO3, respectively. Error bars represent SEM across H-coded genes and nine PFC samples. Functional elements are shown in the legend.


