
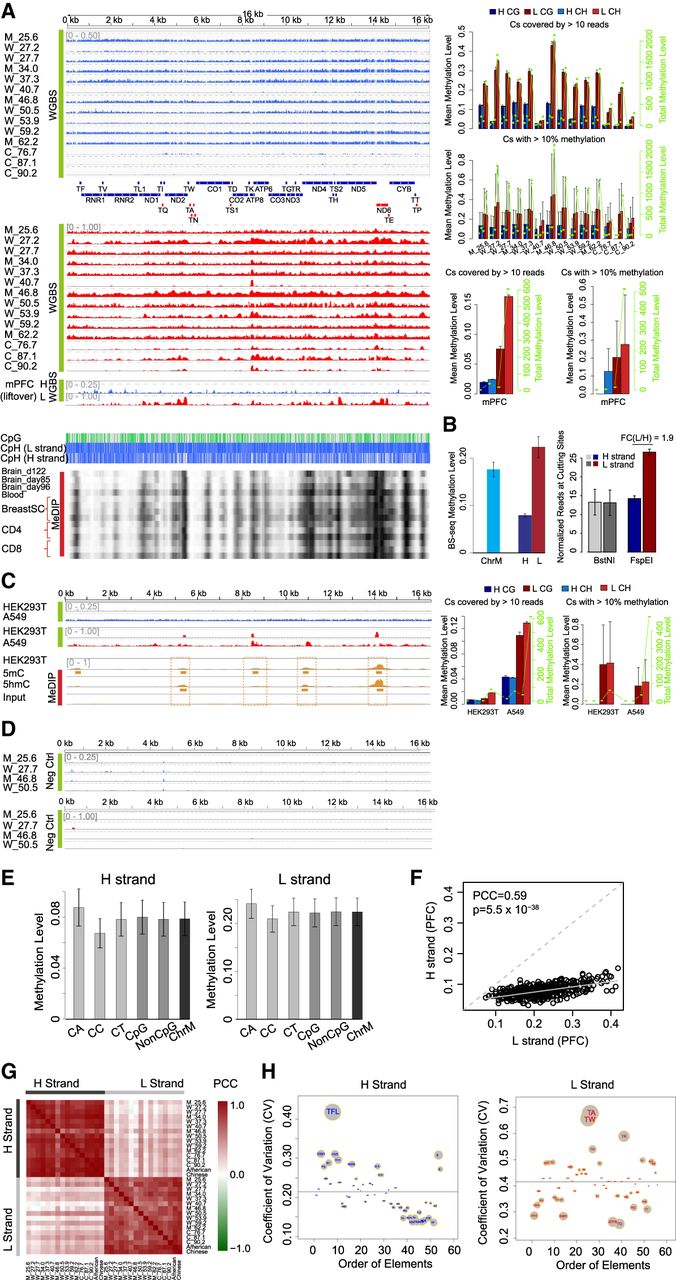
Human mtDNA methylation is highly conserved between individuals, populations, and cell types in a strand-biased fashion. (A, left) BS-seq methylation profiles of mtDNA in human PFC and BS-seq (WGBS) methylation profiles of mtDNA in mouse (GSE33722) PFC samples on the H and L strands, and MeDIP-seq methylation profiles of mtDNA in human brain, blood, breast stem cell, CD4, and CD8 (GSE16368). Different tracks labeled M, W, and C are individual PFC samples (Supplemental Table S3) ranked by their mean ages. Blue tracks show methylation levels of the H strand (scale from 0 to 0.5 for hPFC, and 0 to 0.25 for mPFC), and red tracks show L-strand methylation (scale from 0 to 1). Annotations are as in Figure 1. (B) Mean methylation levels of all cytosines on ChrM, H, and L strand, respectively, in PFC samples. Error bars represent SEM among 14 PFC samples (left). The normalized reads at BstNI and FspEI digestion sites on mtDNA H and L strands in mouse PFC samples (GSE33722), respectively (right). (C, left) BS-seq methylation (WGBS) profiles of mtDNA in HEK293T and A549 on the H and L strands with WGBS, and MeDIP-seq methylation profiles of mtDNA in HEK293T with 5mC and 5hmC MeDIP-seq and the corresponding input. The right panel shows summary statistics as annotated in Figure 1. (D) BS-seq methylation profiles of PCR-amplified mtDNA from four human PFC samples as negative controls. (E) Mean methylation of different cytosine dinucleotides on the H and L strands in 14 human PFC samples. Error bars represent SEM. (F) Scatter plot of mean methylation on CpG sites between the L and H strand in 14 human PFC samples, and each dot represents one CpG site. (G) Heatmap of correlation (PCC) between each pair of human brain PFC samples on the H and L strands. (H) Coefficient of variation (CV) of methylation on each functional element across all samples of PFC on the H or L strand. The size of each element's circle is scaled according to the absolute difference between its CV and the mean of all CVs, which is indicated by the horizontal dashed lines.


