
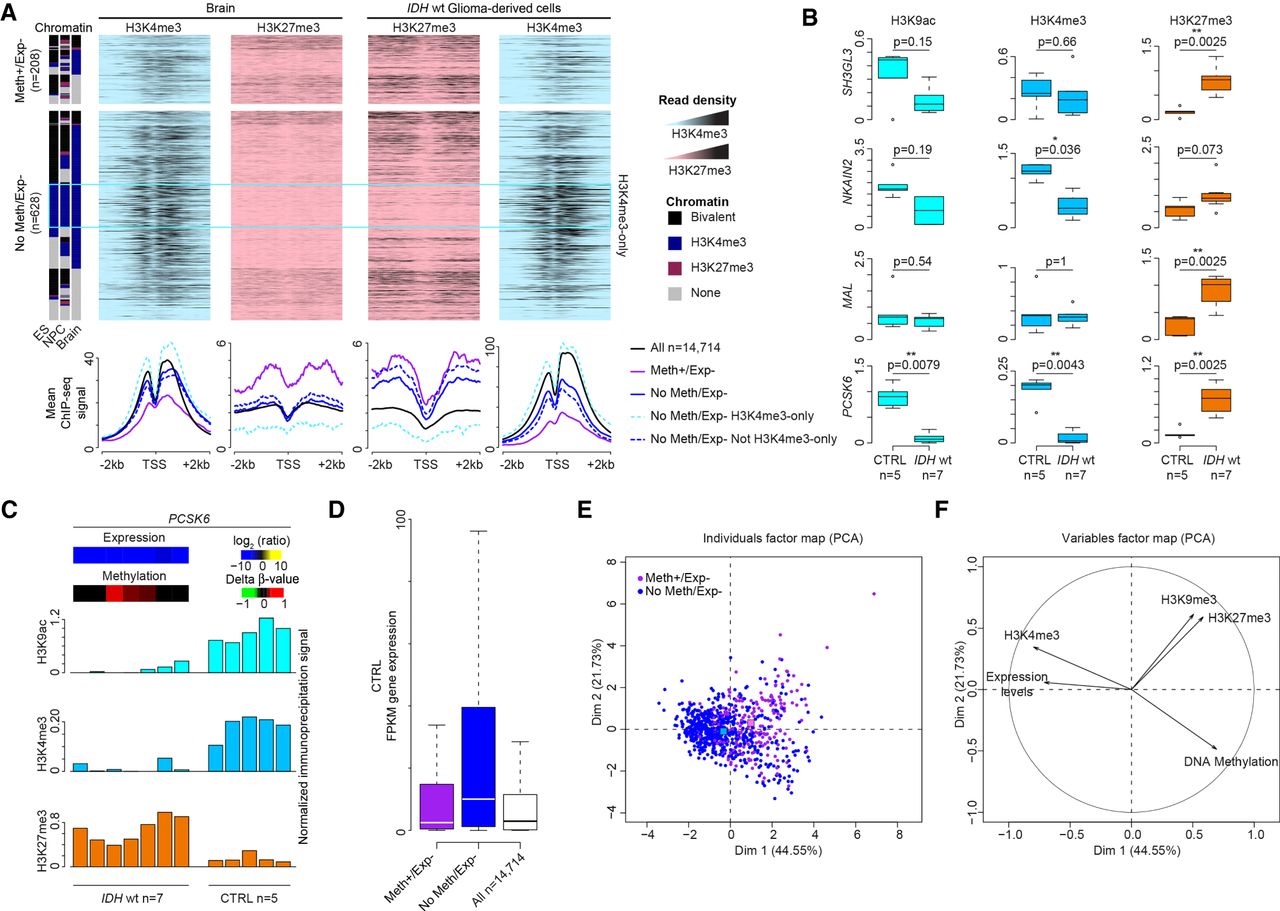
Gene repression is associated with H3K27me3 gain. (A) Data mining–derived ChIP-seq read density data for H3K27me3 (pink) and H3K4me3 (blue) at “Meth+/Exp−” and “No Meth/Exp−” genes in a ±2 kb window centered on their TSS, in healthy brain (left) and IDHwt-derived cell lines (right). The mean ChIP-seq signal values are shown in the lower panels for “Meth+/Exp−” (purple line) and “No Meth/Exp−” (blue line) genes. Genes in the “No Meth/Exp−” group were further subdivided in genes marked (dotted light blue line) and not marked (dotted dark blue line) by H3K4me3-only in ES cells, NPC, and brain. The black line used as normalized reference shows the value for all analyzed genes. (B) ChIP analysis of H3K9ac, H3K4me3, and H3K27me3 at selected genes in IDHwt (n = 7) and control (n = 5) samples. The precipitation level was normalized to that obtained at the TBP promoter (for H3K4me3 and H3K9ac) and at the SP6 promoter (for H3K27me3; P-values calculated with the Mann–Whitney U test). (C) Detail for each sample of the ChIP analysis at the PCSK6 locus. Heatmaps of the expression and methylation values are in the upper panel. (D) Expression level of “Meth+/Exp−” (purple column) and “No Meth/Exp−” (blue column) genes and of all analyzed genes (white column) in healthy controls. (E,F) Principal component analysis. (E) Two-dimensional scatter plot of the values of each “Meth+/Exp−” (purple dots) and “No Meth/Exp−” gene (blue dots) along the first (Dim 1) and second (Dim 2) principal component. For each class defect, the centroids are shown by colored squares. (F) H3K4me3 and expression levels in healthy brain are the variables that most contributed to and were significantly correlated with the first principal component.


