
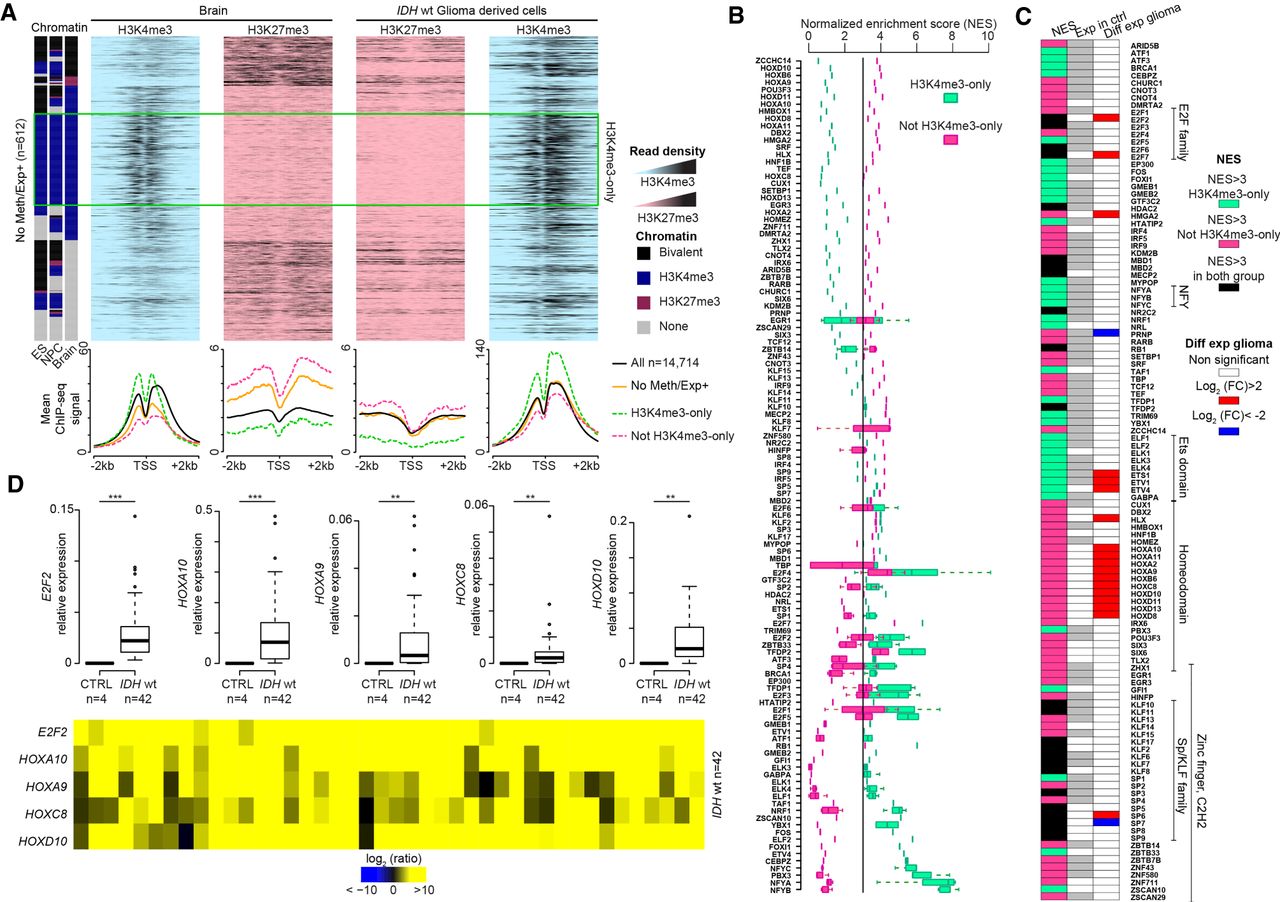
Transcription factor binding motifs in the promoters of genes overexpressed in glioma samples. (A) Data mining–derived ChIP-seq read density data for H3K27me3 (pink) and H3K4me3 (blue) at “No Meth/Exp+” genes in a ±2 kb window centered on their TSS in healthy brain (left) and IDHwt-derived cell lines (right). The mean ChIP-seq signal values are shown on the lower panel for all “No Meth/Exp+” genes (orange line) and for those that are (dotted green line) or not (dotted pink line) marked by H3K4me3-only in ES cells, NPC, and brain. The black line, used as normalized reference, shows the value for all analyzed genes. (B) Transcription factor motif enrichment in the CGI/promoter of “No Meth/Exp+” genes, calculated using i-cis Target and represented as a normalized enrichment score (NES). Enrichment is shown for genes that are (green squares) or are not (pink squares) marked by H3K4me3-only in ES cells, NPC, and brain. When a transcription factor possesses several binding motifs, data are presented as a box plot. (C) Expression status, assessed by RNA-seq, of the transcription factors identified in B. The middle column shows their expression status in healthy control (n = 5) (white, not expressed; gray, expressed: fpkm > 1) and the right column their expression in IDHwt glioma samples (n = 8). The left column shows the motif enrichment in all “No Meth/Exp+” genes (black), and those marked (green) and not marked (pink) by H3K4me3-only in ES cells, NPC, and brain. (D) Expression versus controls of selected overexpressed transcription factor identified in C assessed by RT-qPCR in 42 IDHwt glioma samples. Details for each sample are provided in the lower panel (P-value by Mann–Whitney U test).


