
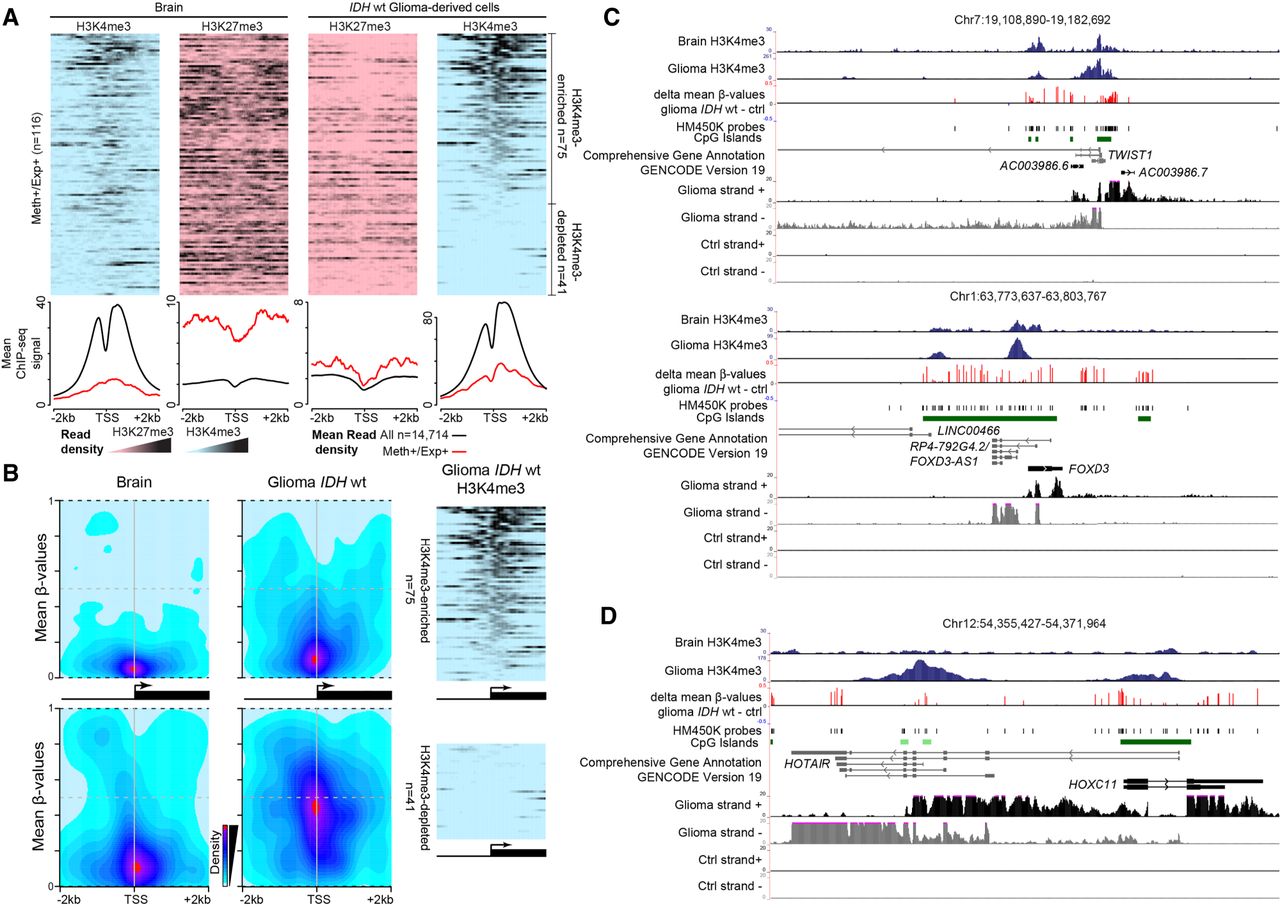
Expression from genes with methylated CGI/promoter. (A) Data mining–derived ChIP-seq read density data for H3K27me3 (pink) and H3K4me3 (blue) in “Meth+/Exp+” genes in a ±2 kb window centered on their TSS, in healthy brain (left) and IDHwt-derived cell lines (right). The mean ChIP-seq signal values are shown on the lower panels for “Meth+/Exp+” genes (red line) and for the 14,714 analyzed genes (black line) that were used as normalized reference. (B) Heatmap showing CpG sites density and their mean methylation level in a ±2 kb window centered on the TSS of “Meth+/Exp+” genes and enriched (upper) or depleted (lower) for H3K4me3 in IDHwt glioma samples compared with healthy controls. The ChIP-seq read density obtained in IDHwt-derived cell lines is shown on the right panels. (C) Genome Browser view at the TWIST1 and FOXD3 loci to show H3K4me3 enrichment, differential DNA methylation, and the oriented RNA-seq signal. These two loci are representative of genes that initiate from an H3K4me3-marked TSS embedded in a methylated CGI/promoter in IDHwt samples. (D) HOXC11 is representative of genes in which expression initiates from an alternative TSS in IDHwt glioma samples.


