
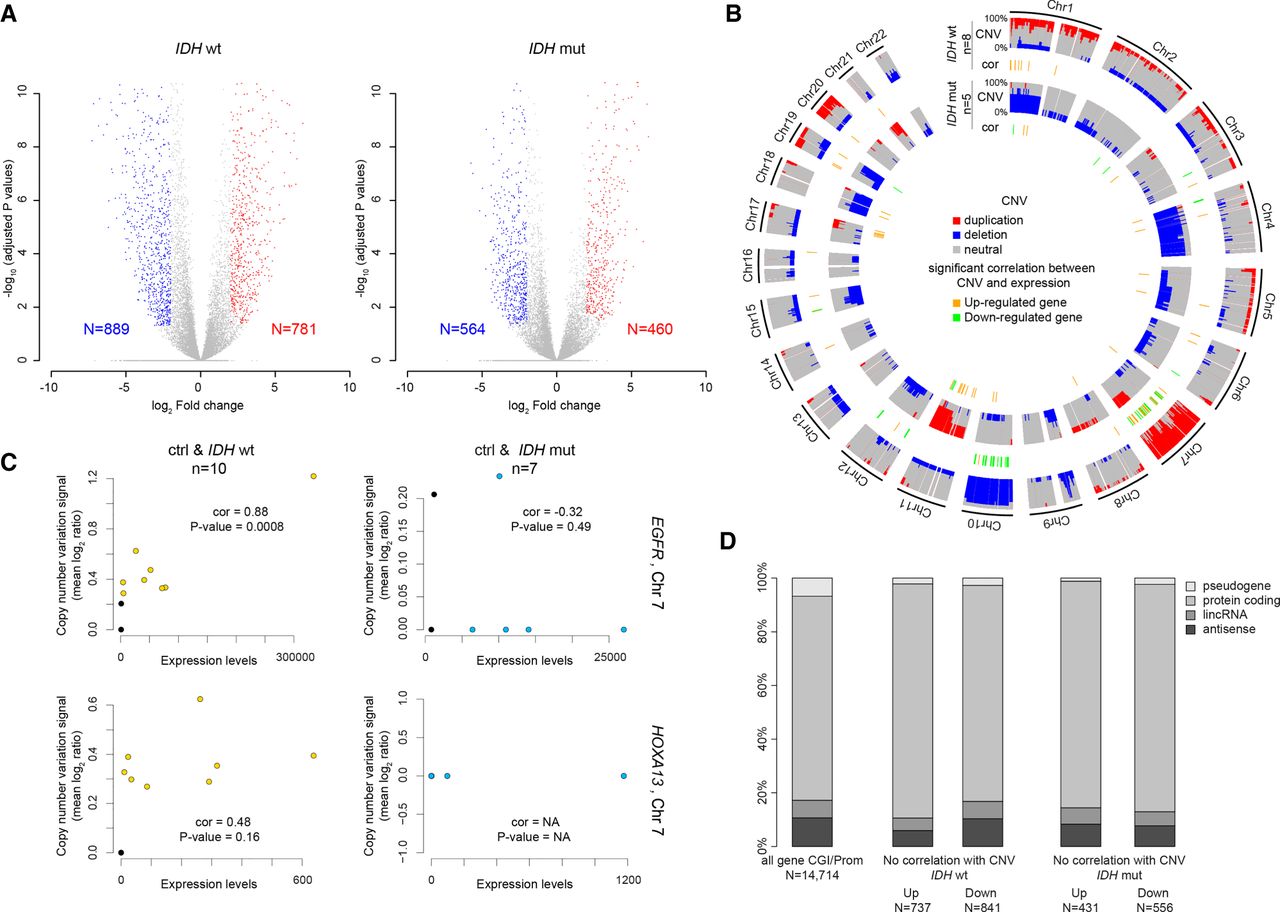
Extent of transcriptional alterations in IDHwt and IDHmut glioma samples. (A) Volcano plot analysis of differential gene expression in IDHwt (left) or IDHmut (right) glioma samples. Blue and red dots represent genes that were significantly down- or up-regulated, respectively, compared with healthy controls (n = 14,714 genes analyzed). (B) Circular karyotype showing the duplication (red) and deletion (blue) frequencies at the 14,714 analyzed genes in IDHwt (outer circles) and IDHmut (inner circles) samples. Genes showing a significant correlation between CNV and expression are symbolized by an orange (up-regulated) or green (down-regulated) line. (C) Correlation analysis between CNV and expression levels for the EGFR and HOXA13 genes in IDHwt (yellow dots, left) and IDHmut (blue dots, right) glioma samples. Black dots indicate value in healthy controls. EGFR overexpression correlated with increased copy number in IDHwt glioma samples. (D) Classification of the genes with expression alterations that did not correlate with CNV.


