
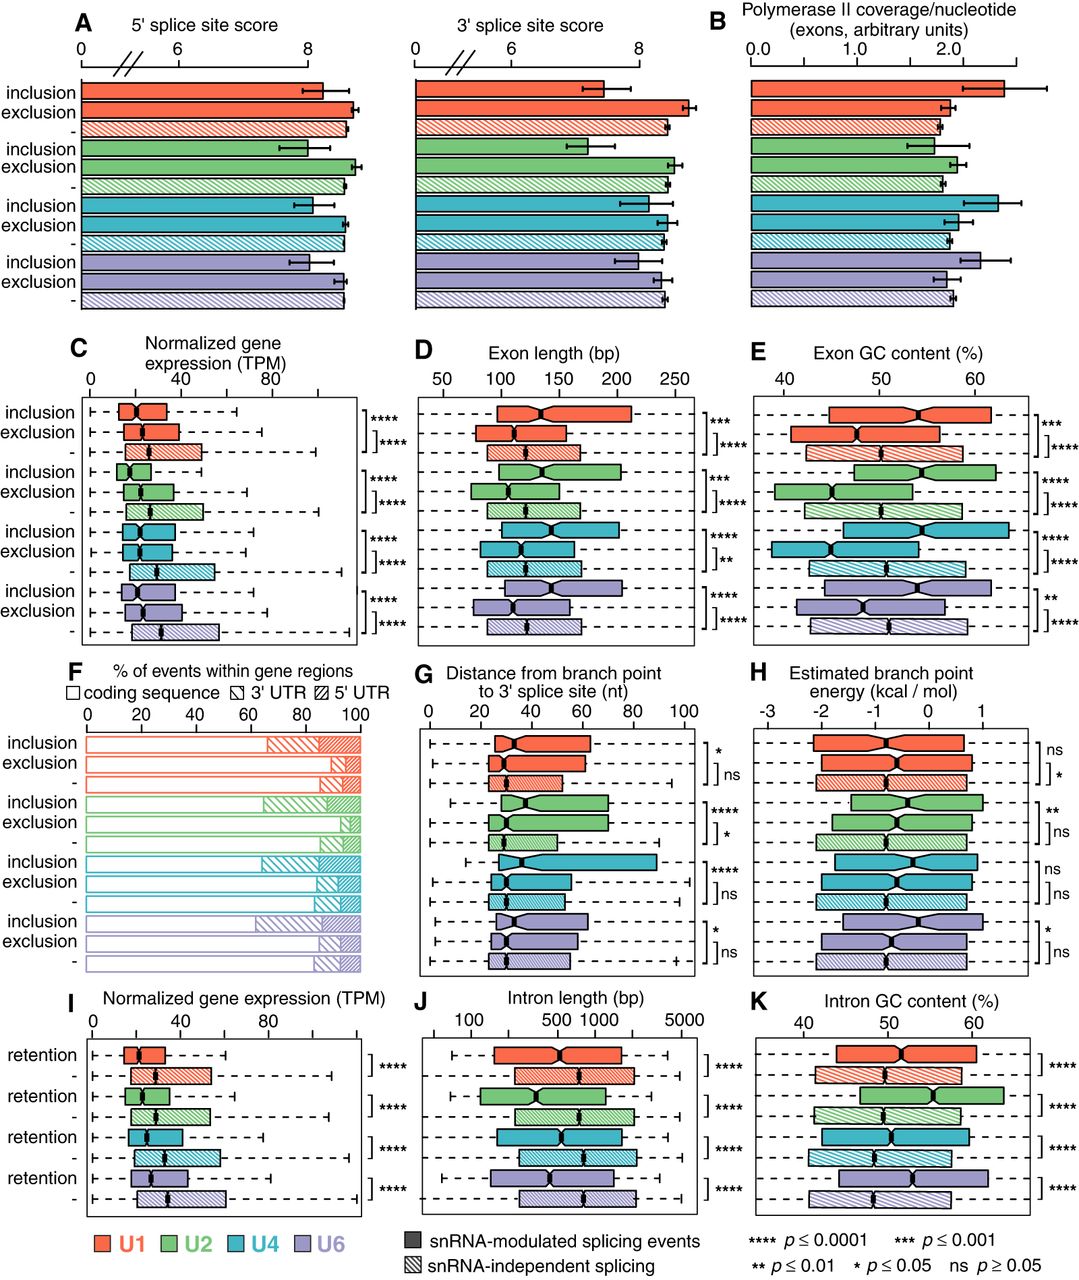
Susceptibility to snRNA depletion is associated with both cis- and trans-acting features. (A) Median scores of 5′ (left) and 3′ (right) splice sites, calculated with the MaxEnt method for the nucleotide sequences spanning the exon–intron boundaries (Yeo and Burge 2004), for exons with increased inclusion or exclusion following snRNA depletion. “−” indicates the genomic average (exons that are not differentially spliced but that can be reliably detected within the illustrated sample). Error bars, 95% confidence intervals, estimated by bootstrapping. Red indicates U1; green, U2; blue, U4; purple, U6. (B) The average per-nucleotide RNA Pol II occupancy of alternatively spliced cassette exons. Error bars, 95% confidence intervals, estimated by bootstrapping. (C) Expression of genes containing differentially spliced exons. (TPM) Transcripts per million. Hinges represent the first and third quartile, and notches illustrate the median ±1.58 interquartile range scaled by the number of introns (IQR/√n), which approximately corresponds to the 95% confidence interval. Statistical significance is calculated using a two-sided two-sample Wilcoxon test: (****) P ≤ 0.0001; (***) P ≤ 0.001; (**) P ≤ 0.01; (*) P ≤ 0.05; (ns) P ≥ 0.05. Distribution of lengths (D) and average GC content (E) of exons showing differential inclusion. Statistical significance as in C. (F) Location of differentially spliced exons with the 5′ UTR, coding sequence, or 3′ UTR of their gene. Distance between branchpoints and 3′ splice sites (G) and the estimated energy for U2 snRNA/branchpoint base-pairing (H) across all exons for which one or more branchpoints present within 200 nt upstream of the 5′ end on the exon (i.e., a 3′ splice site) could be identified from currently annotated branchpoints (Pineda and Bradley 2018). Statistical significance as in C. Outliers are excluded, but the full range of branchpoint distances and energies is displayed in Supplemental Figure S6, A and B. (I) Expression of genes containing differentially spliced introns. TPM and statistical significance as in C. “−” indicates the genomic average (introns that are not differentially retained but that can be reliably detected within the illustrated sample). As human introns are more variable in their lengths than exons, the full range of intron lengths and GC content is displayed in Supplemental Figure S6, E and F. Distribution of lengths (J) and average GC content (K) of introns that are retained following snRNA KD.


