
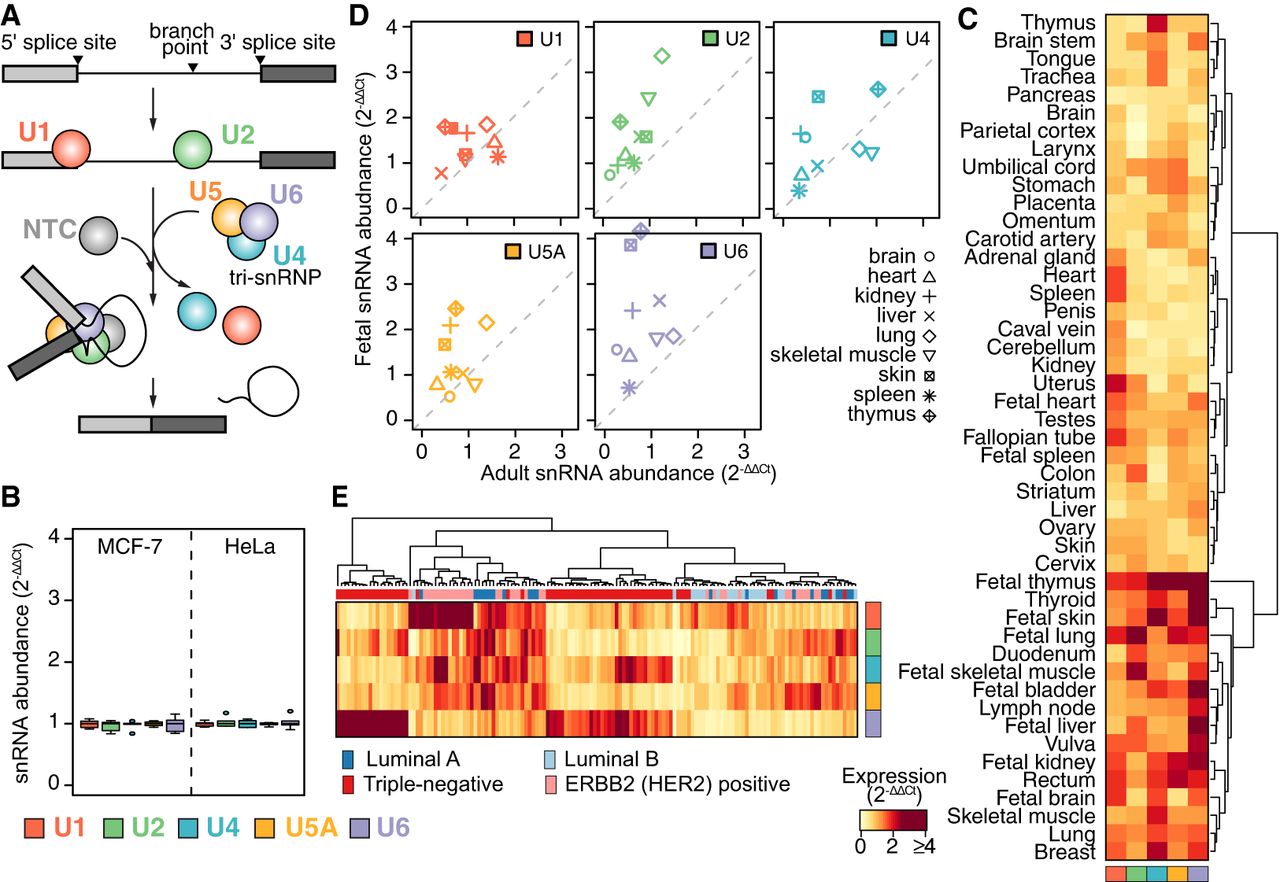
Spliceosomal snRNA abundance is highly variable. (A) Simplified schematic of a single round of splicing, showing individual steps: recognition of the 5′ and 3′ splice sites by the small nuclear ribonucleoprotein complexes (snRNPs) containing the U1 and U2 snRNAs, respectively; recruitment of the U4/U6.U5 tri-snRNP; exit of the U1 and U4 snRNAs and rearrangements of the snRNPs into the conformation required for the active spliceosome; excision of the intron lariat; and ligation of the two adjacent exons. Red indicates U1; green, U2; blue, U4; orange, U5; purple, U6. (B) Reproducibility of ΔCt values from our microfluidic real-time quantitative PCR-based assay to measure snRNA levels across five biological and three technical replicates, using the MCF-7 and HeLa cell lines. For the calculation of ΔCt, the mean of the 7SK RNA, the signal recognition particle RNA (7SL) and 5S rRNA within each tissue was used as a reference. ΔΔCt was calculated relative to the median across individual snRNA within each cell line. (C) Heatmap of relative snRNA abundance across 47 healthy tissues, represented as 2−ΔΔCt. ΔCt values calculated as in B. ΔΔCt values are relative to the median values across all tissues. (D) Expression level (2−ΔΔCt) of snRNAs in adult versus fetal samples from identical tissues. Colors as in A. For comparison with the technical and biological variability (B), scale of the y-axis is kept identical. (E) Variations in snRNA abundance across 144 primary breast cancer specimens, calculated as in C. The column color bar indicates the intrinsic breast cancer subtypes, as defined by immunohistochemistry (IHC) on these samples.


