
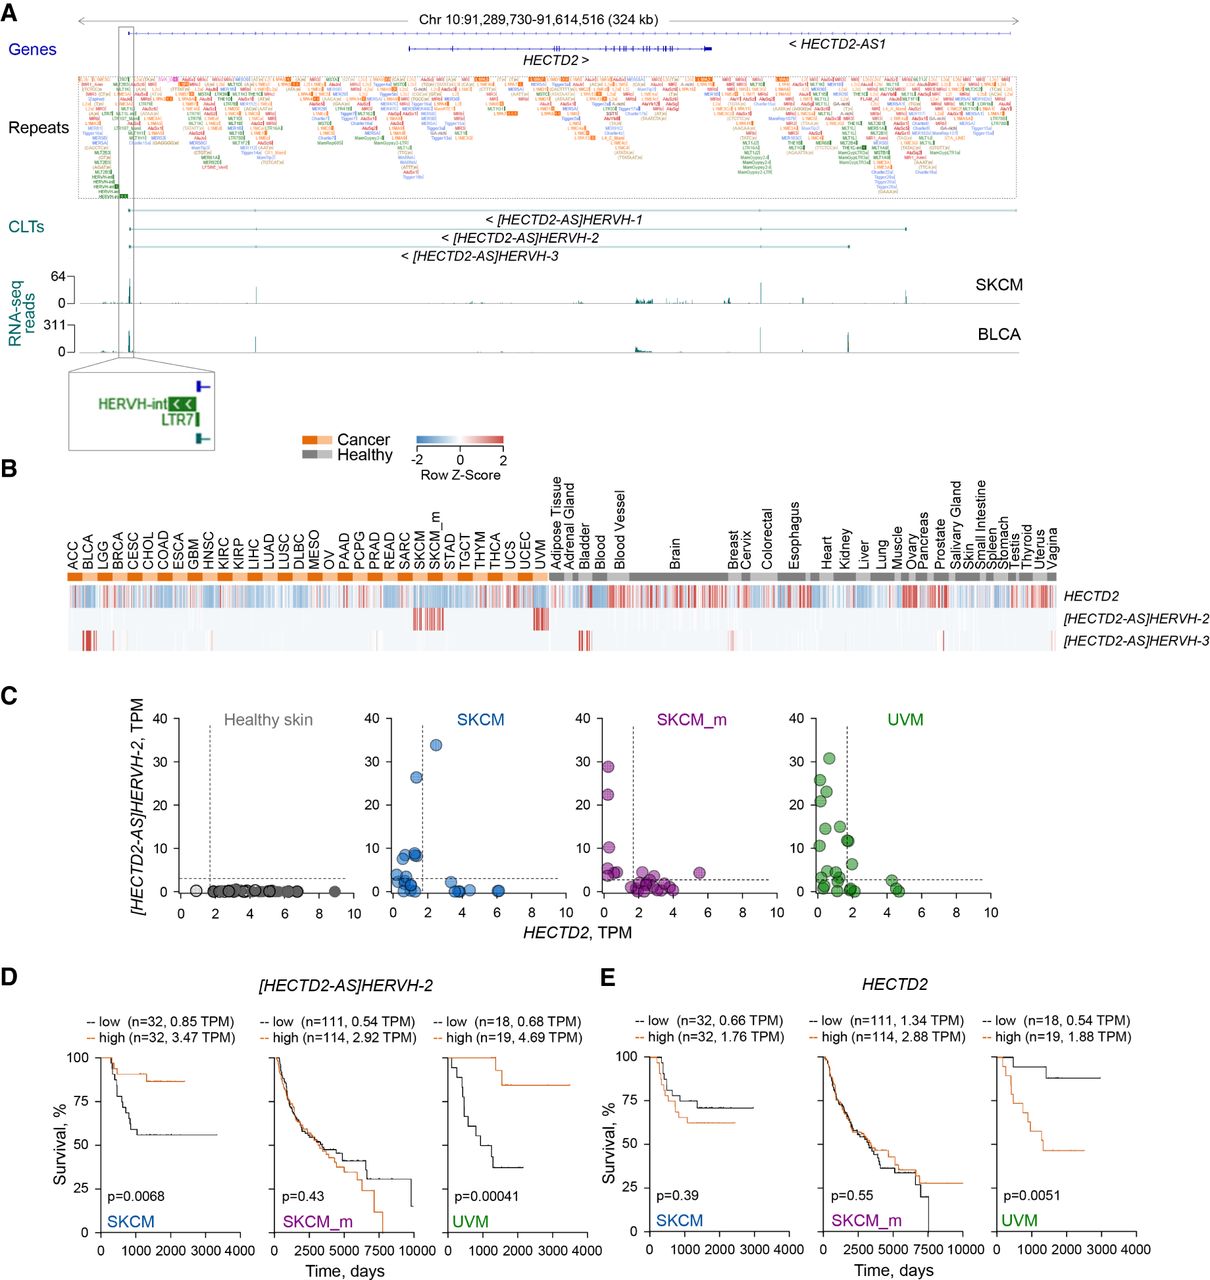
Down-regulation of HECTD2 expression by melanoma-specific antisense transcription of the [HECTD2-AS]HERVH-2 CLT. (A) GENCODE annotated transcripts at the indicated genomic location (genes), repeat content (repeats), CLTs and other selected transcripts at the same location in the current assembly (CLTs), and RNA-seq traces of representative SKCM and BCLA samples. (B) Heatmap of expression values in cancer patient and healthy control samples of HECTD2 and the two indicated antisense transcripts. (C) Anticorrelation of HECTD2 and [HECTD2-AS]HERVH-2 expression (TPM values). Each symbol is an individual patient or healthy control sample. (D,E) Kaplan-Meier plots and P-values from log-rank tests for melanoma patients stratified according to the higher versus the lower expression tertiles for [HECTD2-AS]HERVH-2 (D) and HECTD2 (E). The number of cases and the expression thresholds are also indicated in brackets.


