
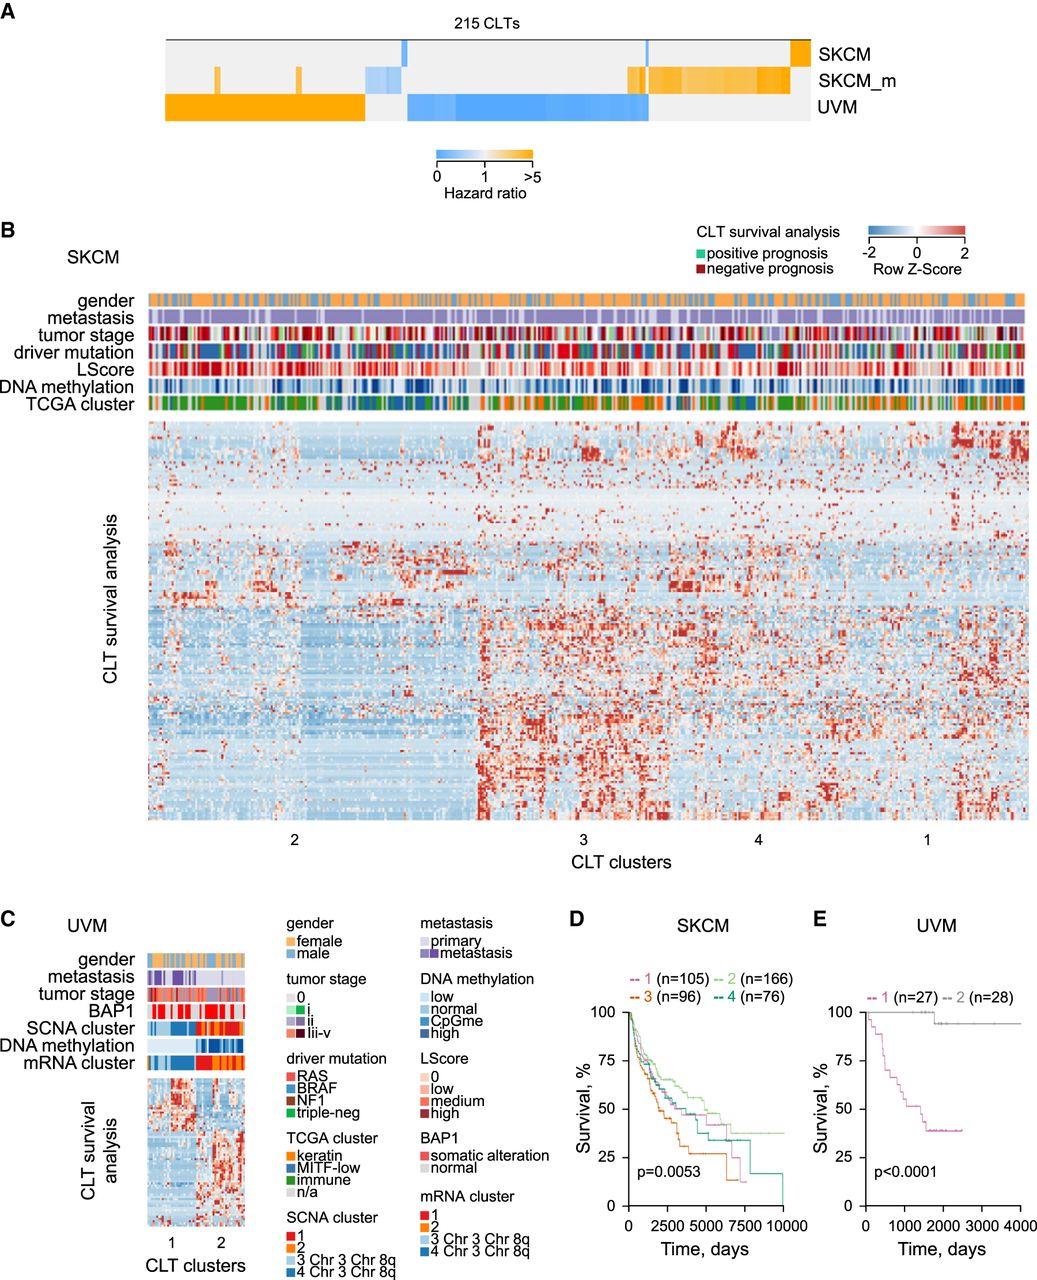
Potential biological processes underlying melanoma association of melanoma-expressed CLTs. (A) Heatmap of hazard ratios, calculated by Cox regression model, of the 215 melanoma-expressed CLTs that were significantly associated with survival probability for each melanoma type of patients in the higher versus the lower expression tertiles. (B,C) Unsupervised clustering of 180 SKCM-prognostic CLTs (B) and 67 UVM-prognostic CLTs (C), according to their expression values (x-axis) and effect on survival probability (y-axis). Also annotated are TCGA-defined clinical and molecular subtypes: (LScore) lymphocyte infiltration score (The Cancer Genome Atlas Network 2015; Robertson et al. 2017). (D,E) Kaplan–Meier plots and P-values from Cox multi-regression model for patients stratified according to the four CLT clusters identified in SKCM (D) and the CLT two clusters identified in UVM (E).


