
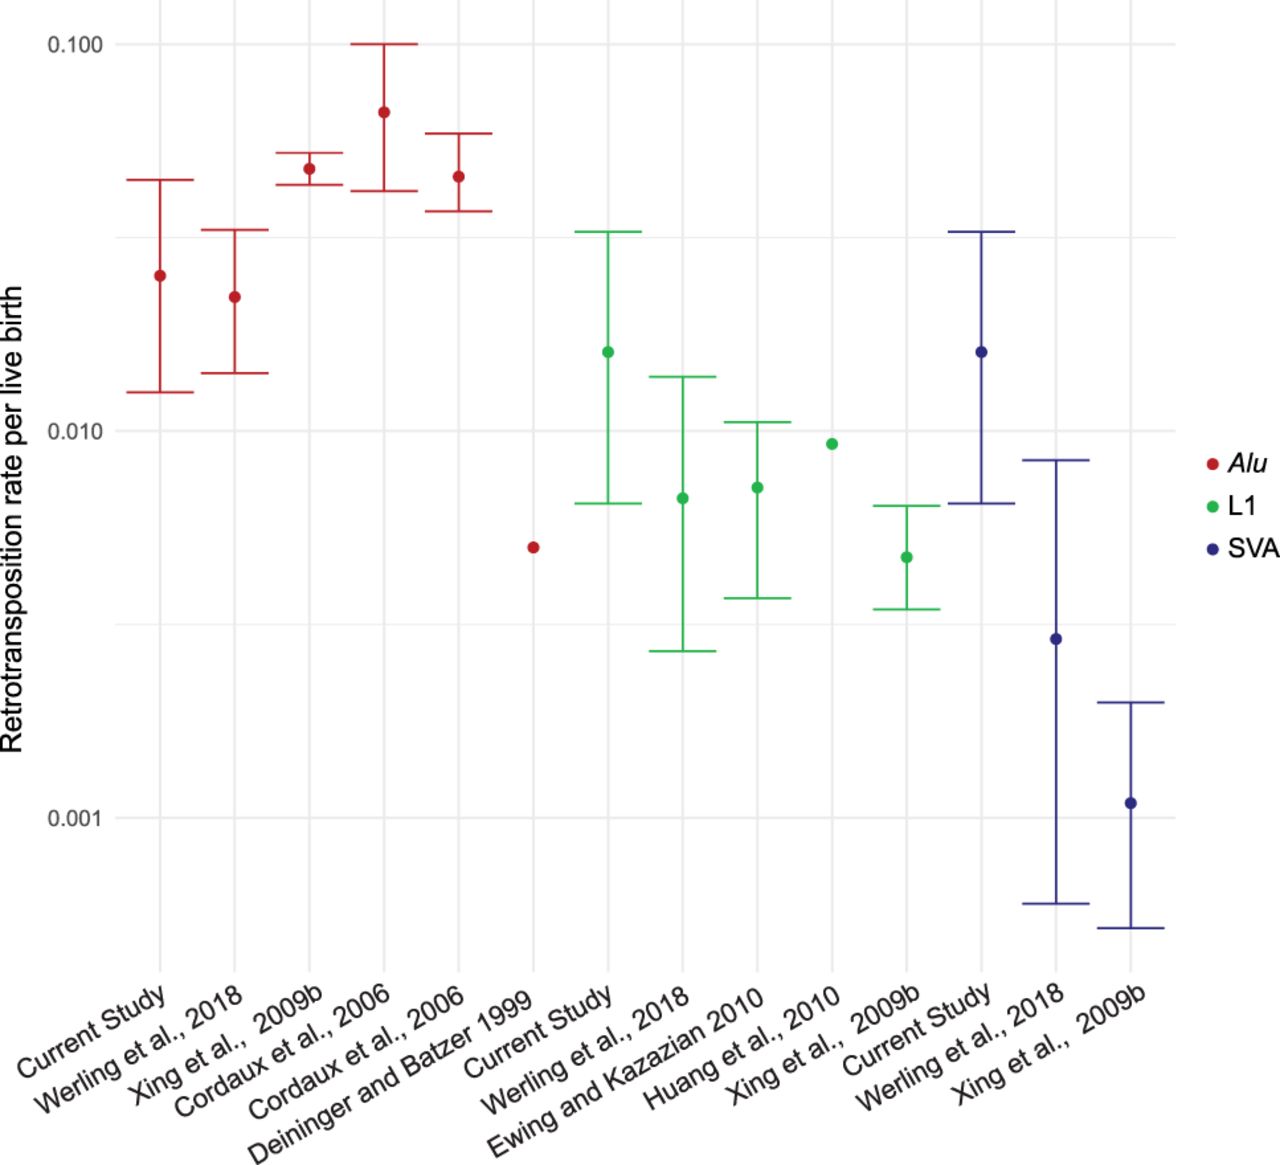
Figure 4.
Estimated retrotransposition rates. Estimated retrotransposition rates for previous studies are listed (Deininger and Batzer 1999; Cordaux et al. 2006; Xing et al. 2009b; Ewing and Kazazian 2010; Huang et al. 2010). Confidence intervals are shown if available from the study. Rates and binomial 95% CI were determined for Werling et al. (2018) and this study. Alu element rates are shown in red, L1 in green, and SVA in blue.


