
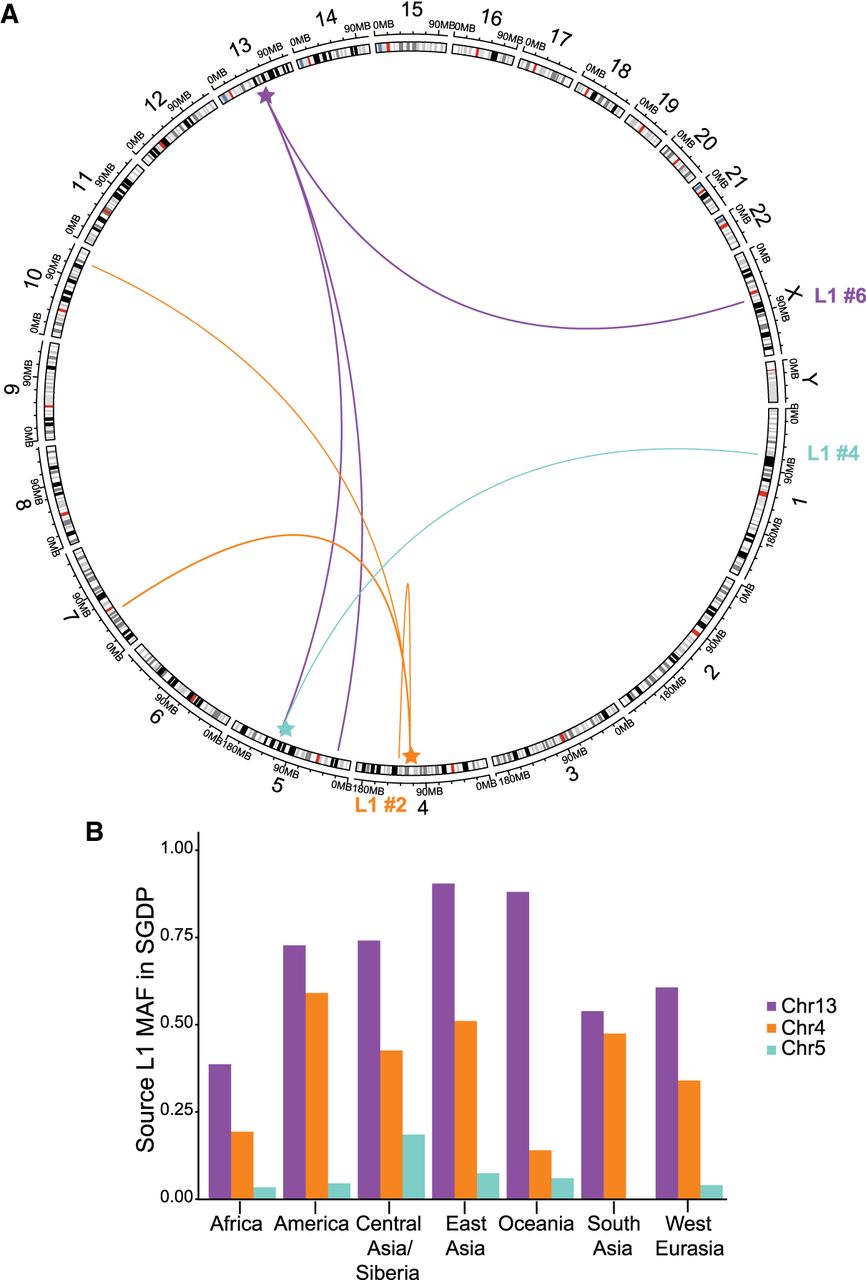
Figure 2.
Three source L1 elements identified by 3′ transductions. (A) Circlize plot of L1 elements to identified offspring elements in the CEPH data set (Gu et al. 2014). Source elements are highlighted with a star. (B) Minor allele frequency (MAF) of the three source elements in the Simons Genome Diversity Project (Mallick et al. 2016). Genotypes were manually typed from IGV screenshots (Supplemental Table S4).


