
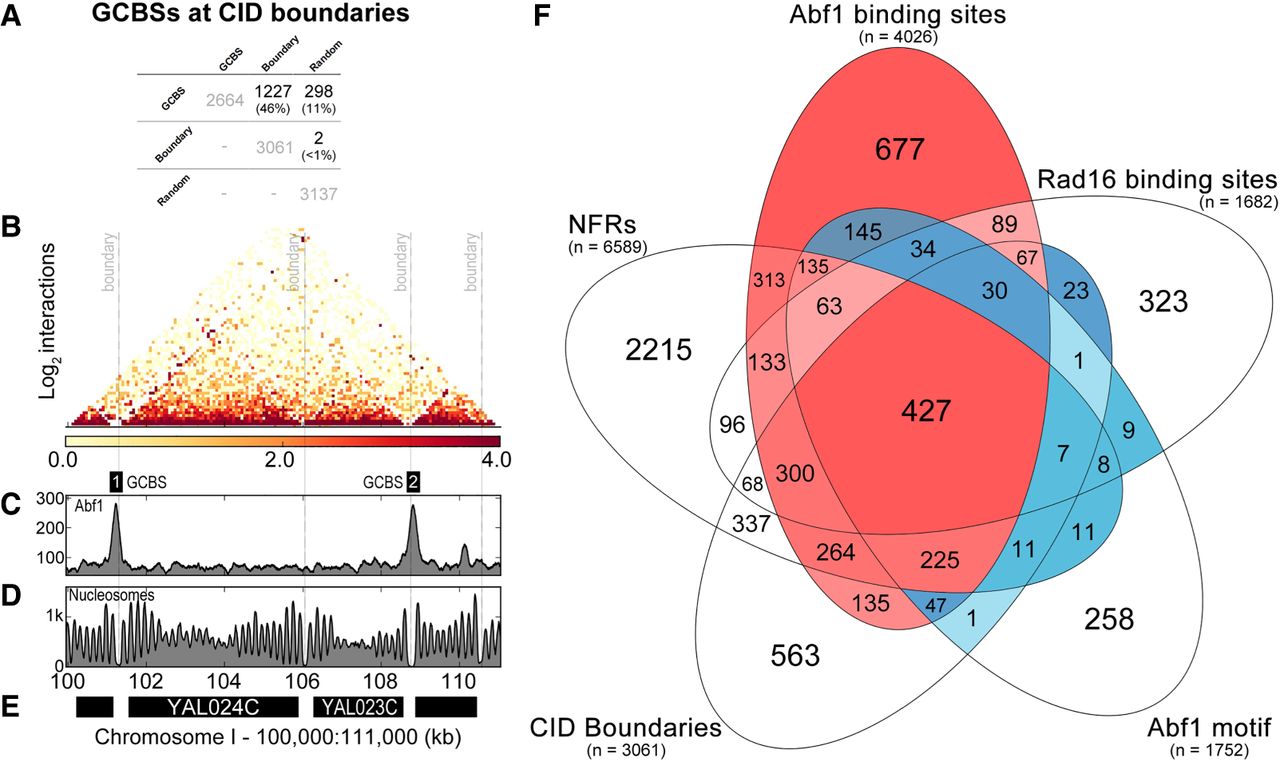
GCBSs are located at the boundaries of chromosomally interacting domains (CIDs). (A) Overlap calculations identified the number and identity of GCBSs (n = 2664) at CID boundaries (n = 3061) and at random sites (n = 3137). The percentage of GCBSs in each subcategory is indicated between brackets. (B) Micro-C data (Hsieh et al. 2016) were used to plot nucleosome–nucleosome interactions in a 11-kbp window on Chromosome I. The gray dashed lines indicate four boundary positions documented in the literature (Hsieh et al. 2015). The intensity of the heatmap is a measure for the normalized interactions indicated beneath the panel. (C) Abf1 ChIP-seq data are plotted here to highlight two GCBSs in this region of the genome labeled as GCBS 1 and 2. (D) The nucleosome landscape is presented here by plotting MNase-seq data at this genomic location. (E) Indicated in black bars are the genes located within this region of the genome. The labels on the x-axis highlight the genomic coordinates in kilobase pairs. The y-axis on each panel indicates peak height as normalized reads. (F) The combined positions of the five features that characterize GCBSs were used to generate a five-way Venn diagram to illustrate how each genomic feature contributes to the formation of a GCBS. Highlighted in red are the predominant classes that make up our list of GCBSs, with intensity signifying the amount of binding sites in each subclass. Conversely, in blue we highlight the Abf1 binding sites and other features that are not classified as GCBSs. Color intensity is used here to indicate the number of features in each subcategory. The number of each feature is listed between brackets.


