
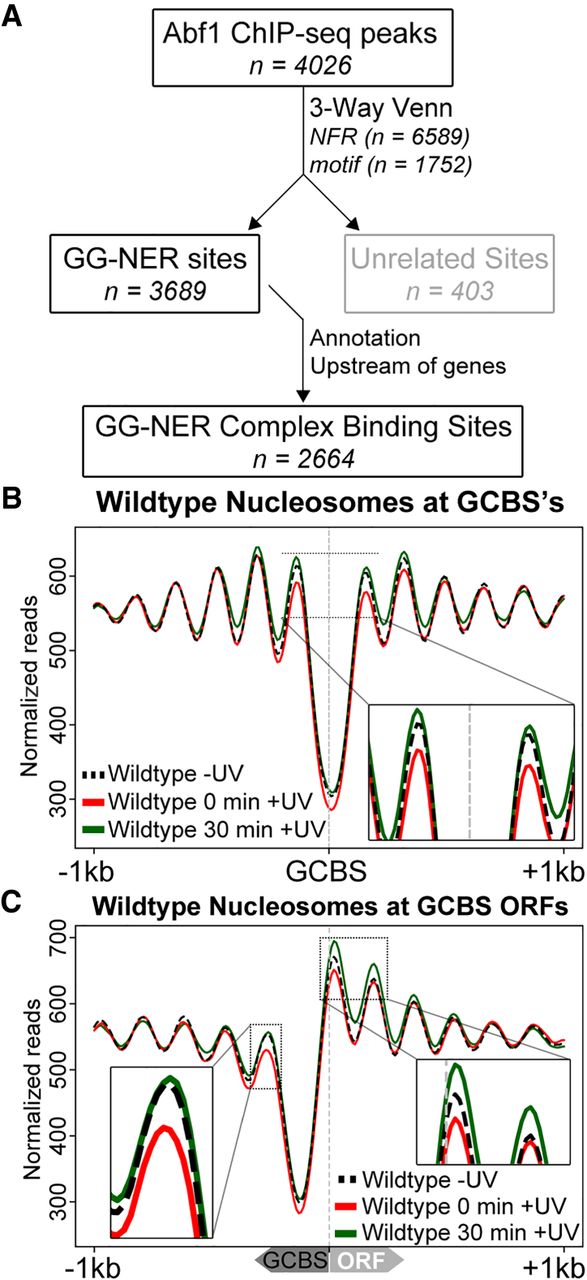
Identification of the genomic list of GCBSs and the nucleosome occupancy in relation to these sites. (A) Flow chart to illustrate the bioinformatics analysis performed to identify genome-wide GCBSs by refining and filtering the list of Abf1 ChIP-seq peaks using NFR positions, motif sites, and annotation information. (B) MNase-seq data of wild-type cells were used to plot cumulative nucleosome positions around GCBSs (n = 2664) in the absence of UV irradiation and at different intervals after UV irradiation, displaying regularly spaced nucleosome arrays at these genomic locations. The x-axis denotes the 2-kbp regions surrounding the GCBSs, while the y-axis indicates nucleosome occupancy as measured by normalized reads. (C) Nucleosome occupancy in wild-type cells before and after UV damage. MNase-seq data of untreated and UV-treated cells are shown as cumulative graphs around GCBSs in relation to ORF structure. The insets highlight the nucleosome remodeling at the −1 position (left) and the remodeling at positions +1 and +2 (right).


