
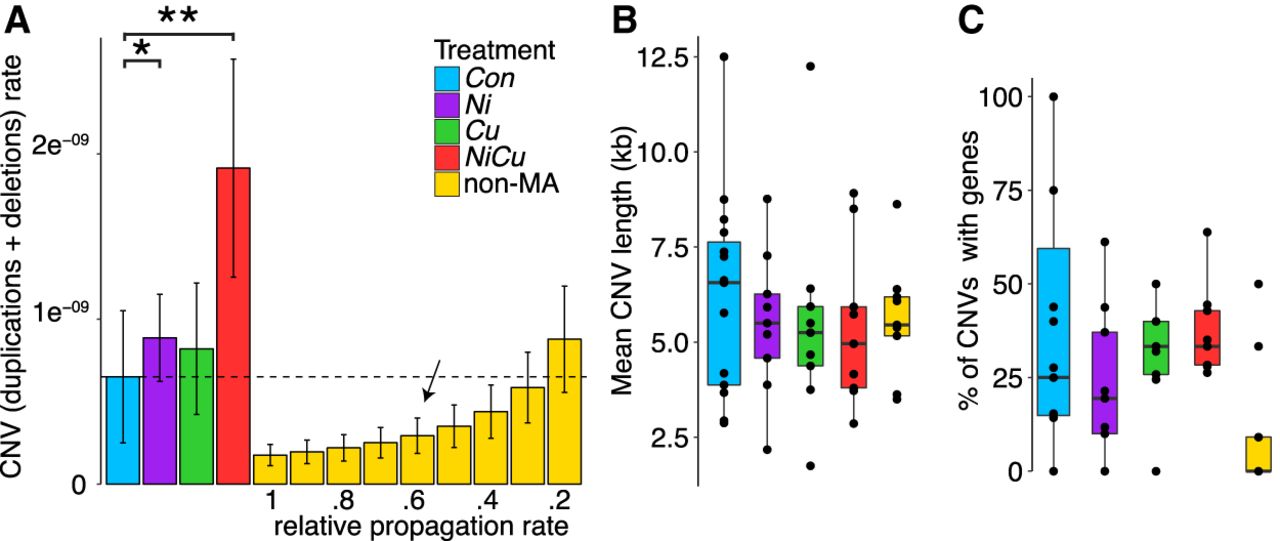
CNV rates and lengths, with and without selection. (A) Mean CNV rates (sum of duplications and deletions per nucleotide per generation) and standard errors among MA treatment groups showing significant differences among treatments: (*) P < 0.01; (**) P < 0.005. A comparison with non-MA isolates given various relative propagation rates compared to MA lines is shown, with a dotted line indicating the relative propagation rate in non-MA genomes to reach the same mutation rates as in control MA lines. We estimated the relative propagation rate based on a life history experiment (indicated with an arrow). (B) Box plot of CNV length distributions across treatments. (C) The percentage length of CNV regions that overlap genes, in which only a single non-MA isolate has genes deleted, and two more isolates had a gene duplication.


