
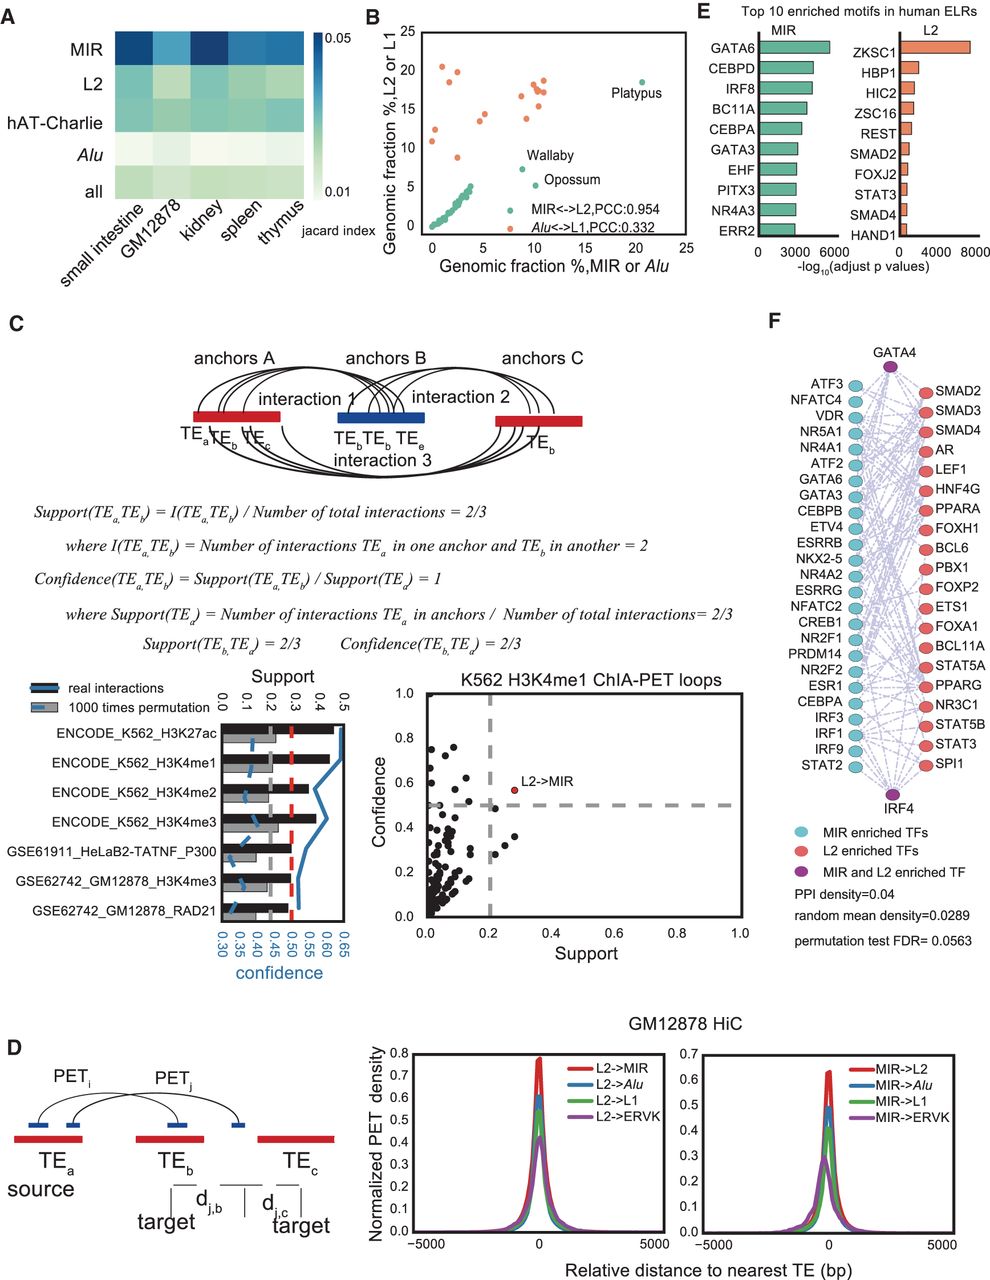
Association between MIR and L2. (A) Heat map of Jaccard index between the same type of human and mouse tissues or cell lines for human and mouse overlapping ELRs. (B) Correlated genomic ratio between MIR and L2, or Alu and L1 across chordate species. Three outlier points (all Australian species) are labeled. (PCC) Pearson's correlation coefficient. (C) Support and confidence for association between L2 to MIR between ChIA-PET loop anchors; only significant samples were shown. Lower left panel, the gray bars and dashed lines indicate support and confidence background expectation for L2 to MIR interactions in the same number of randomly selected regions as ChIA-PET interaction anchors. Lower right panel, the H3K4me1 ChIA-PET interactions from L2 to MIR (both are ELRs) in K562 cells, which is the case in the lower left panel. Black (real loops) and gray (random background) bars measure the support; blue line (real loops) and blue dashed line (random background) indicate the confidence; gray and red dashed line indicate the support (0.2) and confidence (0.5) cutoffs. Red dots mark those that have significantly higher support and confidence compared to the all possible TE family pairs background. (D) Density of distant L2-interacting tags that fall into MIR, Alu, L1, ERVK, or another L2 based on the dense 1-kb resolution in situ Hi-C data of GM12878 (GSM1551552). ERVK is included as a negative control. Density of distantly L2 (or MIR)-interacting tags that fall into MIR (or L2), Alu, L1, and ERVK. (E) Top 10 enriched motifs on MIR and L2 ELRs in human cells. (F) Protein-protein interaction network (STRING v10.0) among top 50 TFs that have enriched motifs on MIR and L2 ELRs.


