
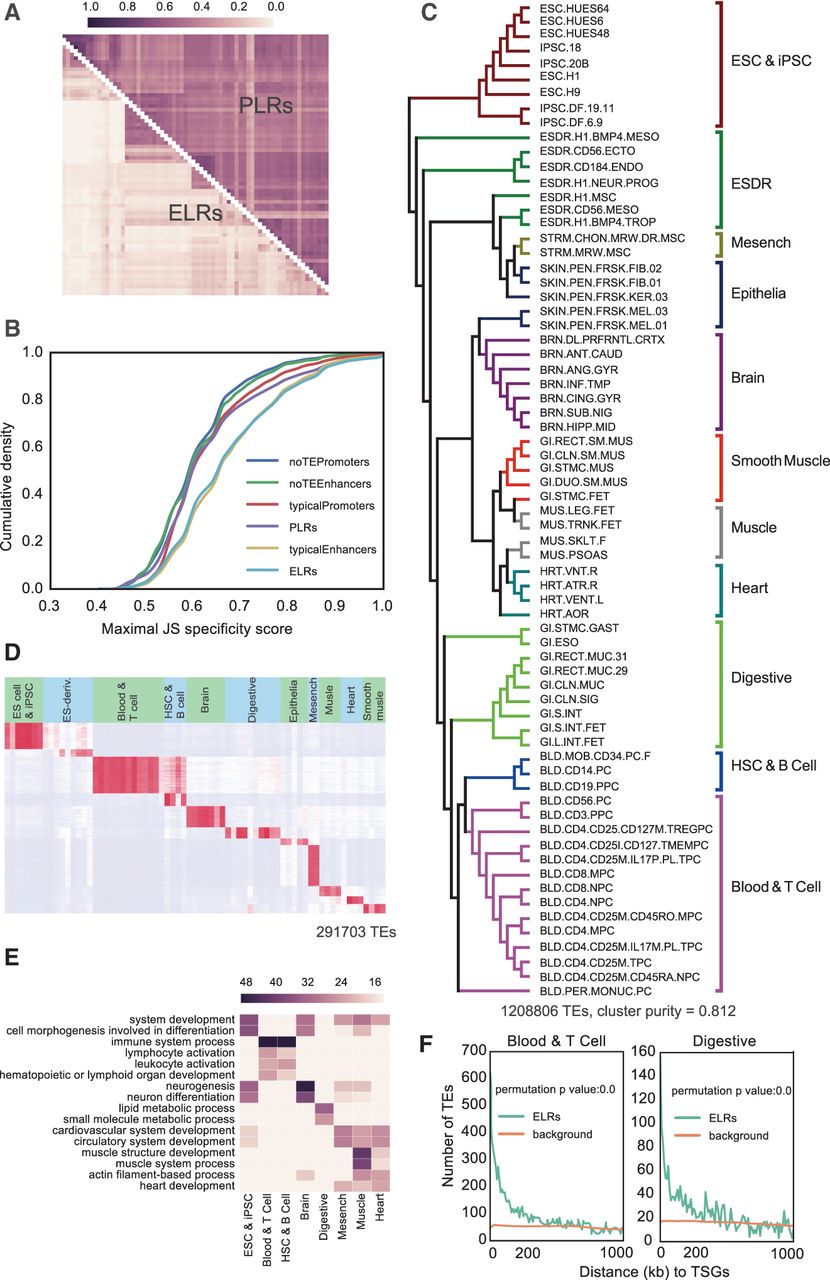
ELRs mark cell identities. (A) Correlations of each pair of tissues and cell lines based on their ELRs and PLRs presence/absence (1/0) profiles within the tissues. Cells are grouped by annotation from NIH Roadmap Epigenomics. (B) Cumulative density of maximal tissue specificity metric Jensen-Shannon divergence (JSD) for all ELRs, PLRs, typical enhancers/promoters defined by ChromHMM and the fragment sequences from typical enhancers/promoters without TEs overlap that match any tissue-specific pattern. (C) Neighbor joining tree (NJT) of the NIH Roadmap Epigenomics samples based on all ELRs’ presence/absence profiles, with the ESC and iPSC branch set as the root. (D) Heat map of the ELRs (maximal JSD > 0.7) binary matrix, from 1 (red) to 0 (white), across different NIH Roadmap Epigenomics cell lines. (E) Heat map of enrichment P-values for the top enriched GO terms of each cluster. (F) Frequency histogram of absolute distances from each TE to the nearest tissue-specific genes (TSGs) in the group of Blood and T cell and Digestive tissues.


