
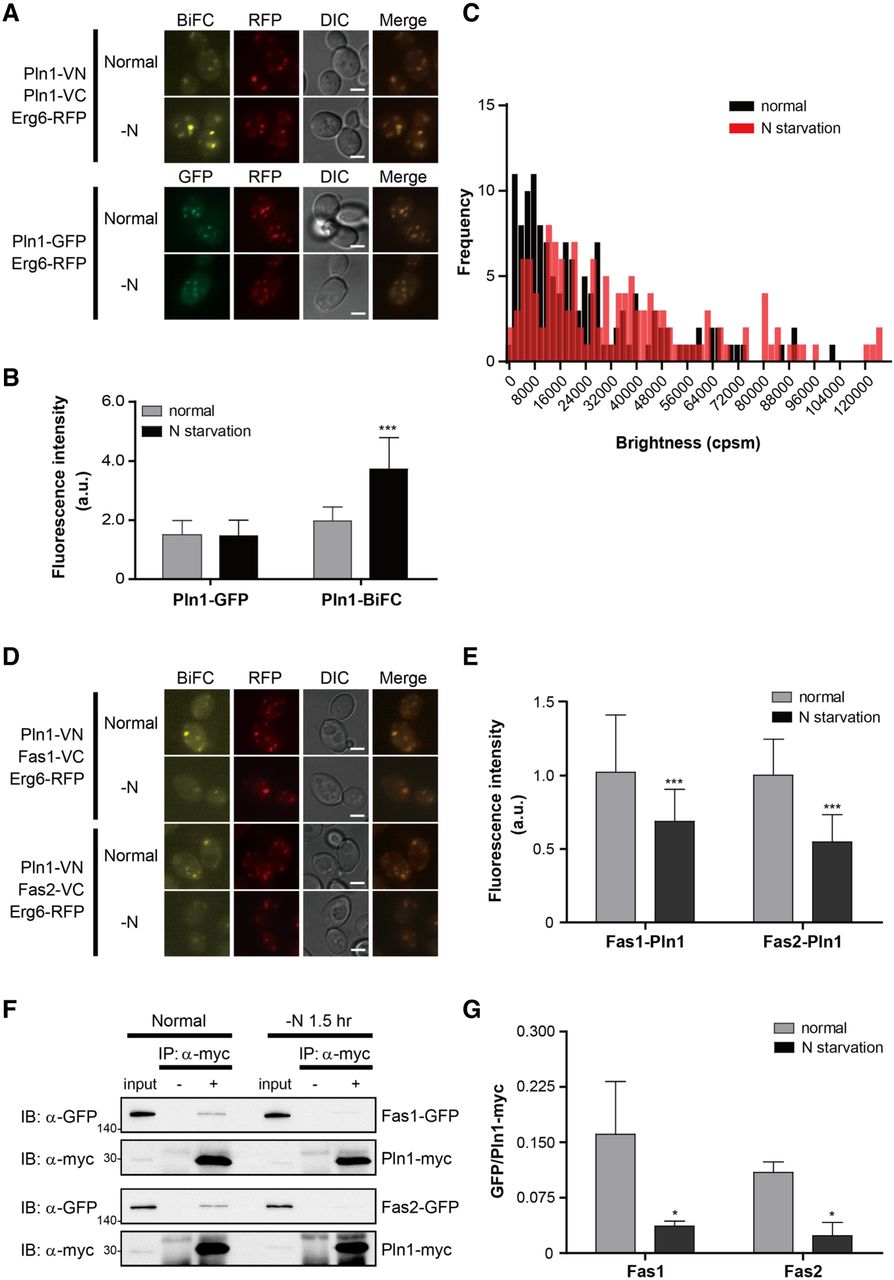
Homomerization of Pln1 and its interactors. (A) Representative BiFC and GFP images of Pln1 under the normal conditions and nitrogen starvation. Erg6-RFP was used as a lipid droplet marker. Scale bars, 2 μm. (B) Quantification of the fluorescence intensity of cells in A. Gray and black bars indicate the fluorescence intensity of cells under the normal conditions and nitrogen starvation, respectively. Error bars, SD. Asterisks indicate significant differences compared with the normal conditions (Student's t-test): (***) P < 0.001. (C) PCH analysis of Pln1-GFP. The brightness (counts per second per molecule [cpsm]) of Pln1-GFP under the normal conditions and nitrogen starvation was counted and shown as a histogram. Black and red bars indicate the frequency of Pln1-GFP fluorescence under the normal conditions and nitrogen starvation, respectively. One hundred forty cells were counted under each condition. Statistical significance was determined by Student's t-test (P = 0.0097). (D) The BiFC assay for the interaction of Pln1 with Fas1 and Fas2. Erg6-RFP was used as a lipid droplet marker. Scale bars, 2 μm. (E) Quantification of the fluorescence intensity of cells in D. Gray and black bars indicate the fluorescence intensity of cells under the normal conditions and nitrogen starvation, respectively. Error bars, SD. Asterisks indicate significant differences compared with the normal conditions (Student's t-test): (***) P < 0. 001. (F) Co-IP assay to validate the interaction of Pln1 with Fas1 and Fas2. Co-IP assay was performed using the Myc-tagged Pln1 expressed under the ADH1 promoter and GFP-tagged Fas1 and Fas2. The positions of molecular-weight markers (in kDa) are indicated on the left of each blot. (G) Quantification of Co-IP in F. The ratios of GFP-tagged proteins co-precipitated with Pln1-Myc were calculated by using ImageJ (Schneider et al. 2012). Values represent the average of three independent experiments; error bars, SD. Asterisks indicate significant differences compared with the normal conditions (Student's t-test): (*) P < 0.05.


