
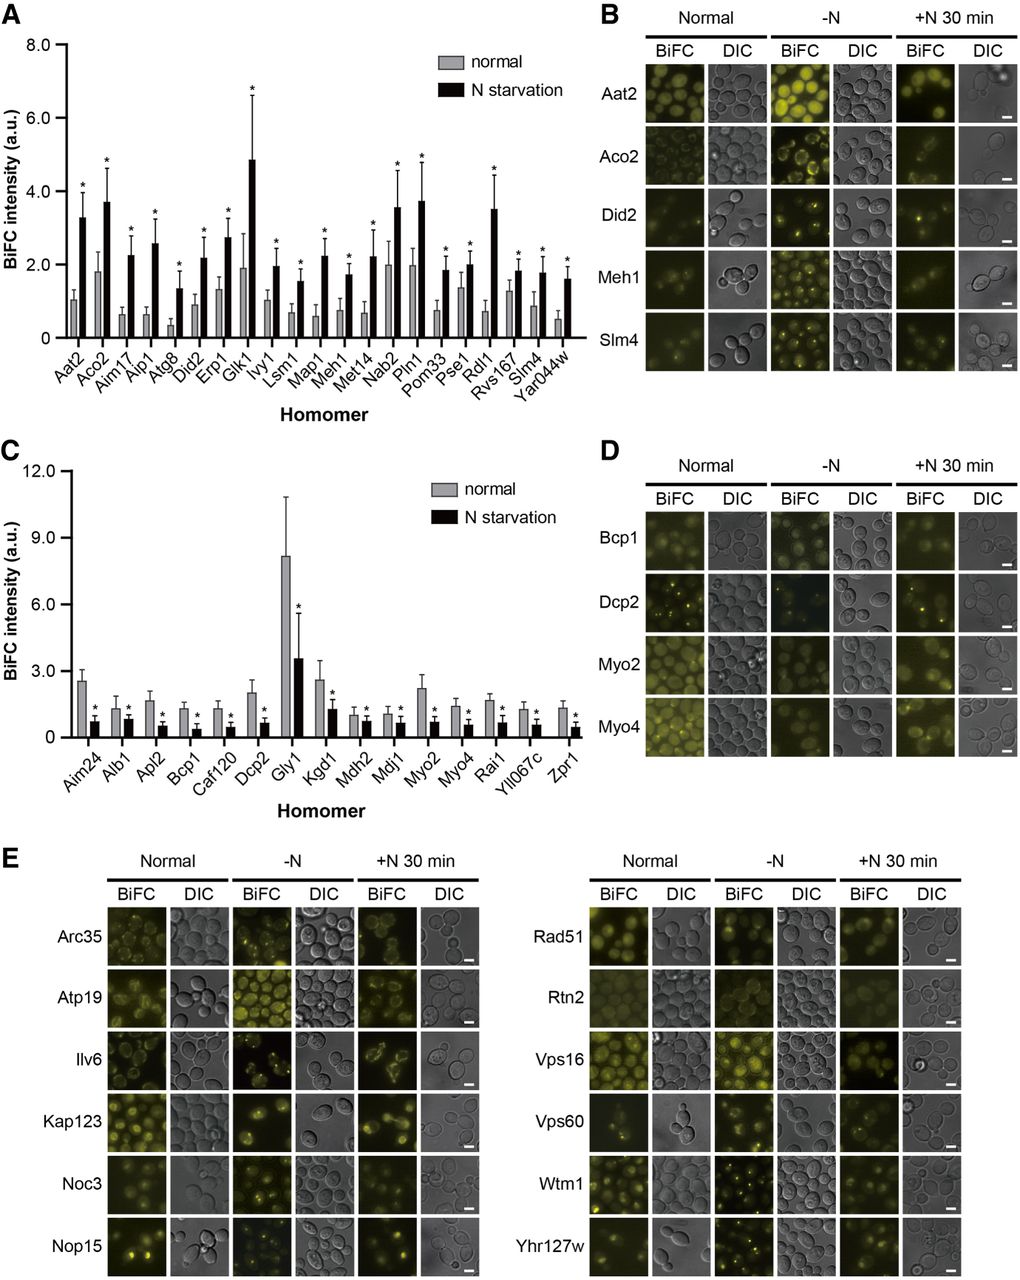
Changes in protein homomerization upon nitrogen starvation. (A,C) Protein homomers showing increased (A) or decreased (C) BiFC signals upon nitrogen starvation. Gray and black bars indicate the mean BiFC signal intensity of protein homomers under the normal conditions and nitrogen starvation, respectively. Error bars, SD. Asterisks indicate significant differences compared with the normal conditions (Student's t-test): (*) P < 0.05. For detailed information, see also Supplemental Table S11. (B,D,E) Representative BiFC images of protein homomers showing increased (B), decreased (D), or localization-changed (E) BiFC signals upon nitrogen starvation and restored signals after transfer to nitrogen-containing medium. Scale bars, 2 µm.


