
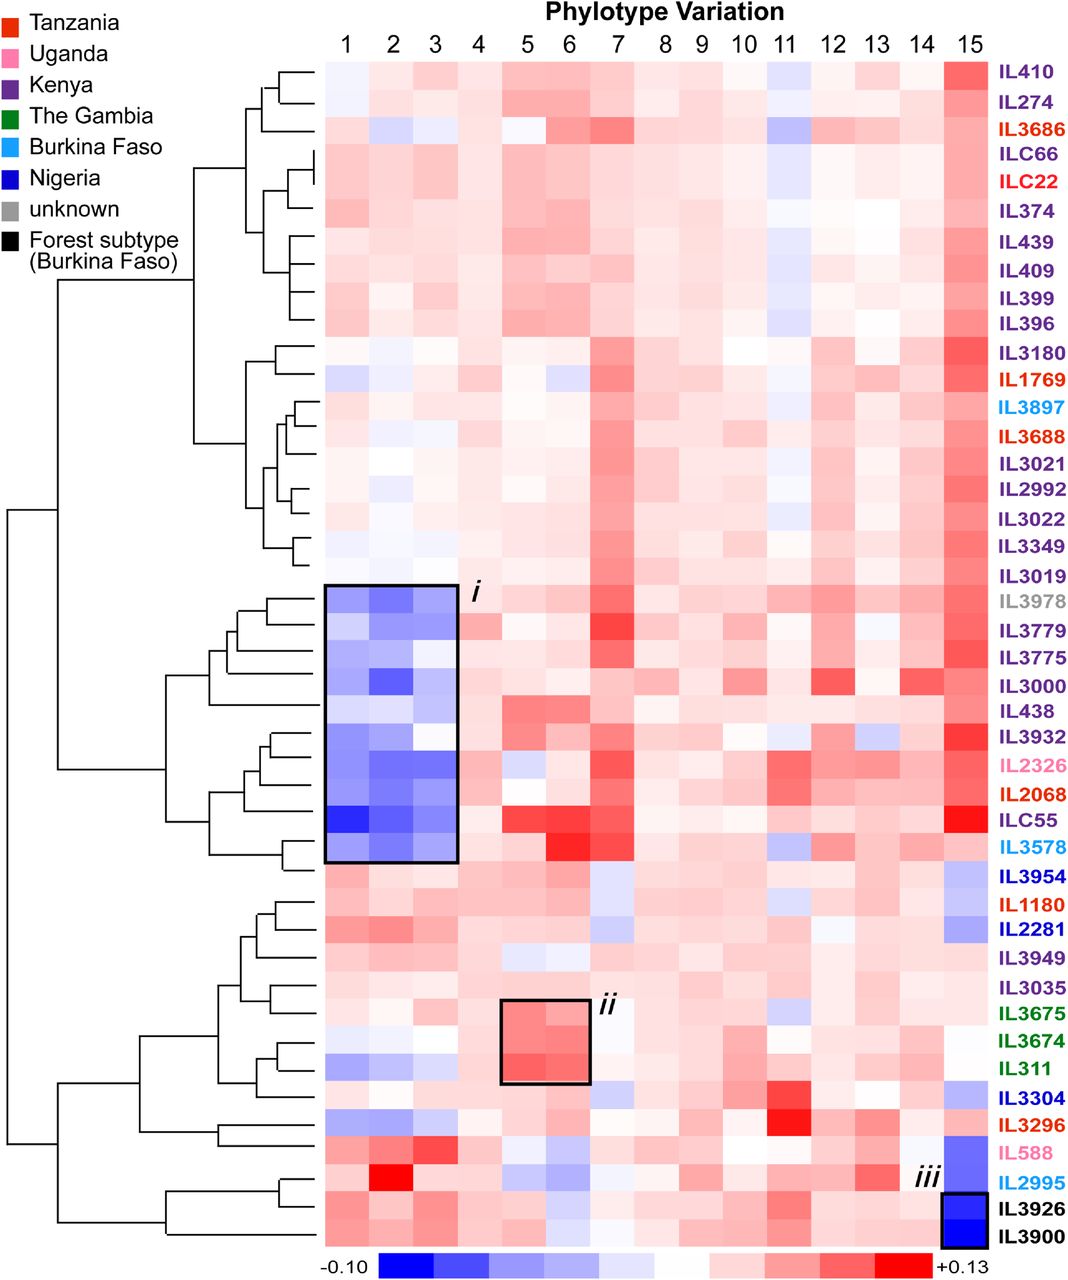
Figure 4.
Phylotype variation across the sample cohort. The heatmap represents phylotype variation across the sample cohort expressed as the deviation from the mean. The dendrogram reflects the relationships among the VSG repertoires of each strain. Strains are color-coded by location of collection according to the key. Labels “i” to “ii” denote examples of phylotype variation signatures referred to in the text. Label “i” shows a pattern of underrepresented P1-3 among strains of multiple countries; “ii” shows a pattern of overrepresented P5-6 in Gambian isolates; “iii” shows a pattern of underrepresented P15 common to Forest-subtype isolates.


