
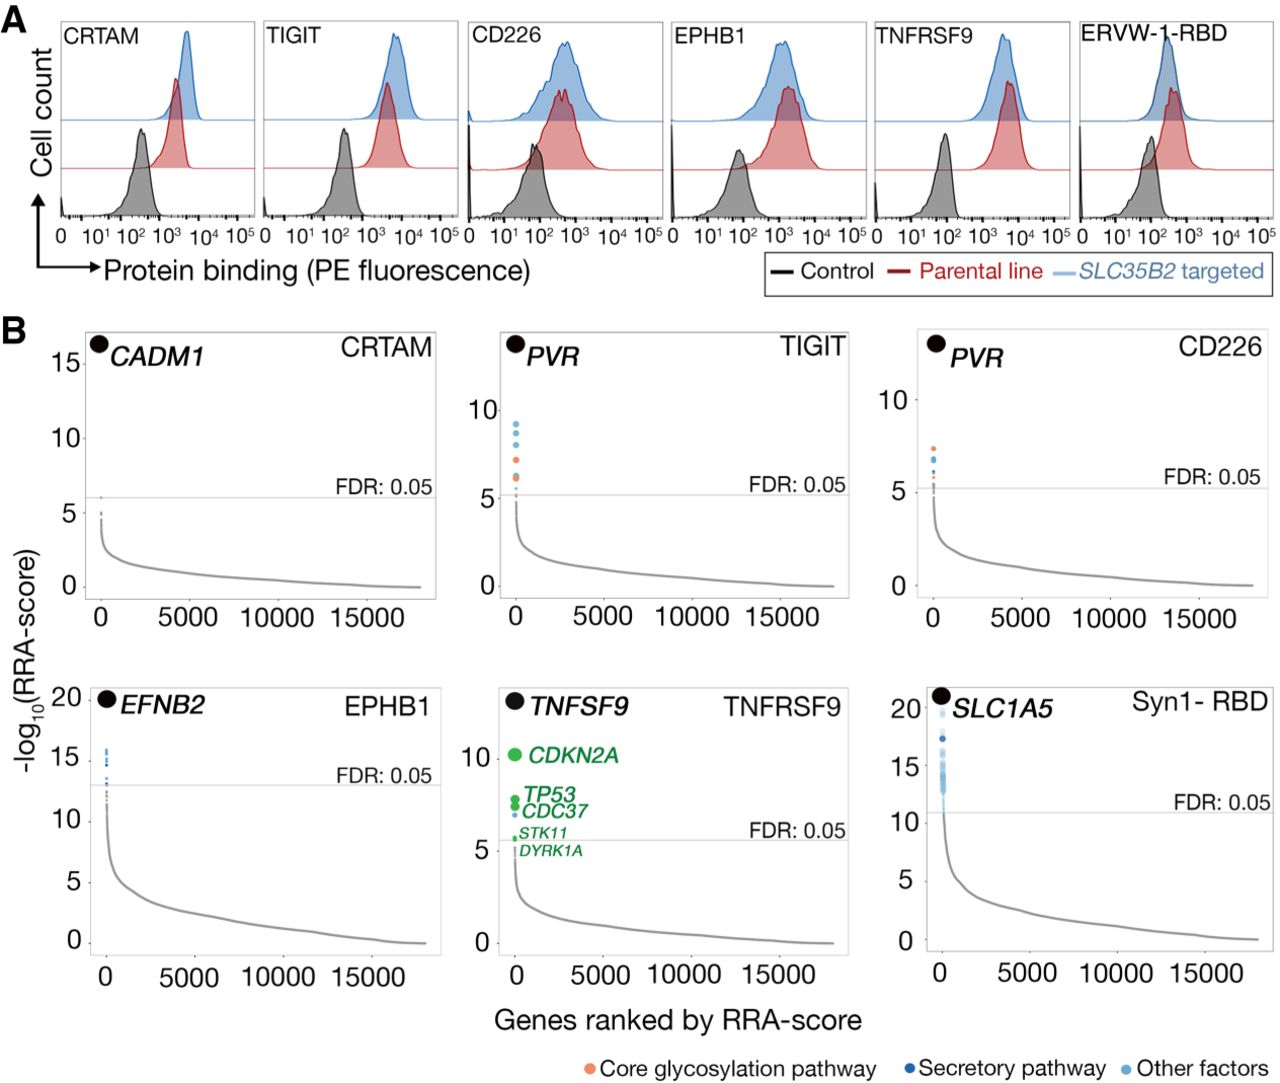
Identification of cell adhesion receptors and pathways using cell-based genetic screens. (A) The indicated oligomeric probes were tested for binding to the unmodified parental cell line (red histograms) or polyclonal SLC35B2-targeted cells (blue); representative experiments of three technical replicates are shown. The HEK293 cell line was used for all proteins except TNFRSF9, which is the NCI-SNU-1 line. (B) RRA-score rank-ordered genes identified from gRNA enrichment analysis from sorted cells that had lost binding to CRTAM, TIGIT, CD226, EPHB1, TNFRSF9, and ERVW-1 (ERVW-1-RBD); in all six cases, the gene encoding the known receptor was identified as the most significantly enriched gene. In B, genes with FDR < 5% are labeled with colors corresponding to related functions (full screening results available in Supplemental Data S3).


