
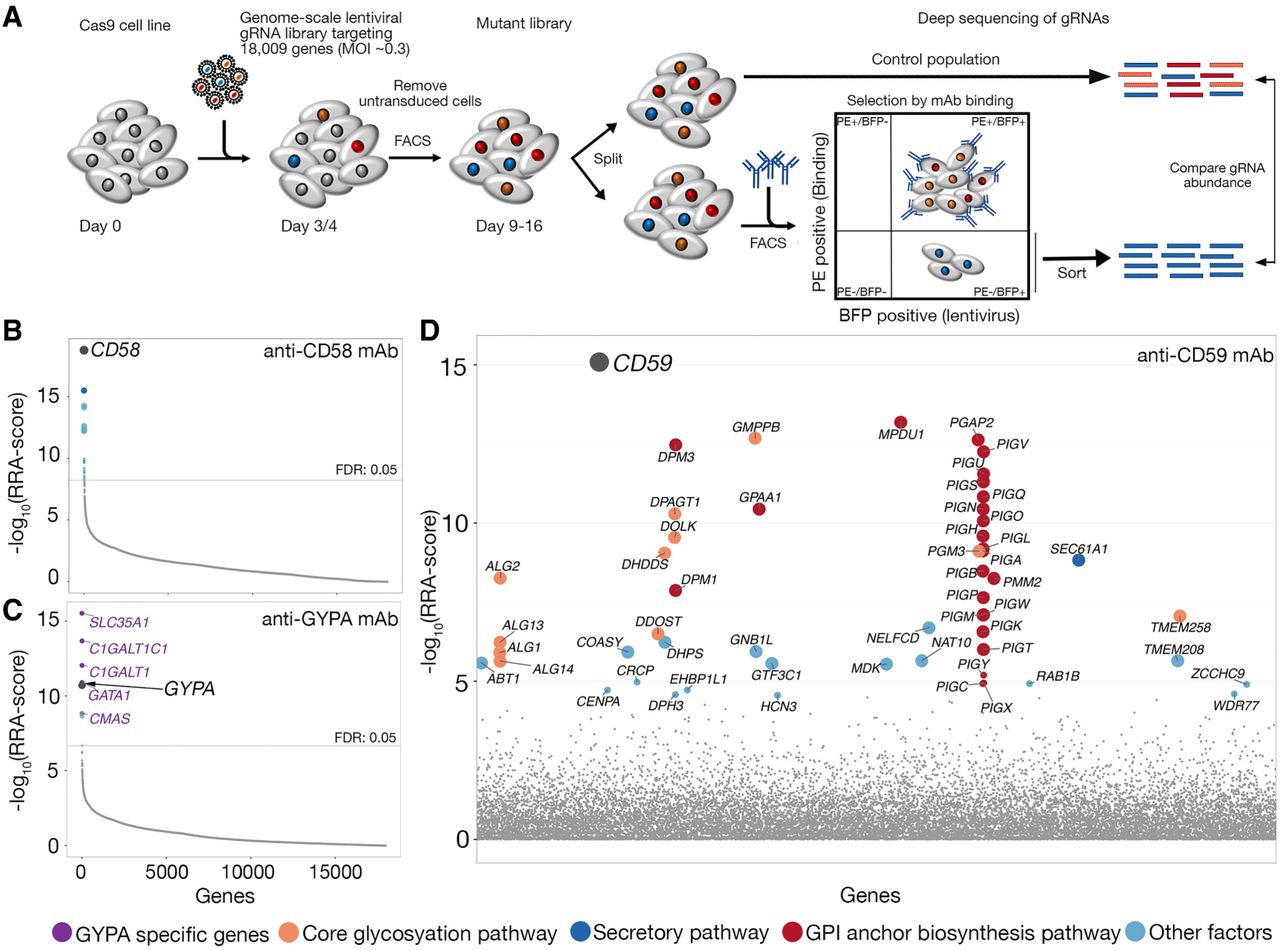
A cell-based genome-scale CRISPR-KO approach identifies pathways required for monoclonal antibody surface epitope recognition. (A) Schematic of the approach based on CRISPR/Cas9 technology using a genome-scale lentiviral gRNA library. Genes identified as being required for surface display of the epitope recognized by an anti-CD58 (B) and anti-GYPA (C) mAbs. The enrichment of gRNAs targeting each gene is quantified as the robust rank aggregation (RRA) score calculated using the MAGeCK software between selected cells that had lost the mAb epitope versus control cells and is shown plotted in rank order. (D) Genes identified as being required for surface display of the epitope recognized by an anti-CD59 mAb; here, genes are ordered alphabetically for clarity. Circles represent individual genes and are sized according to their false-discovery rate (FDR): large circle = FDR < 1%, small circle = 1% < FDR < 5%. Genes encoding the direct receptors are indicated with gray circles. Only genes with FDR < 5% are named and are color-coded according to their function.


