
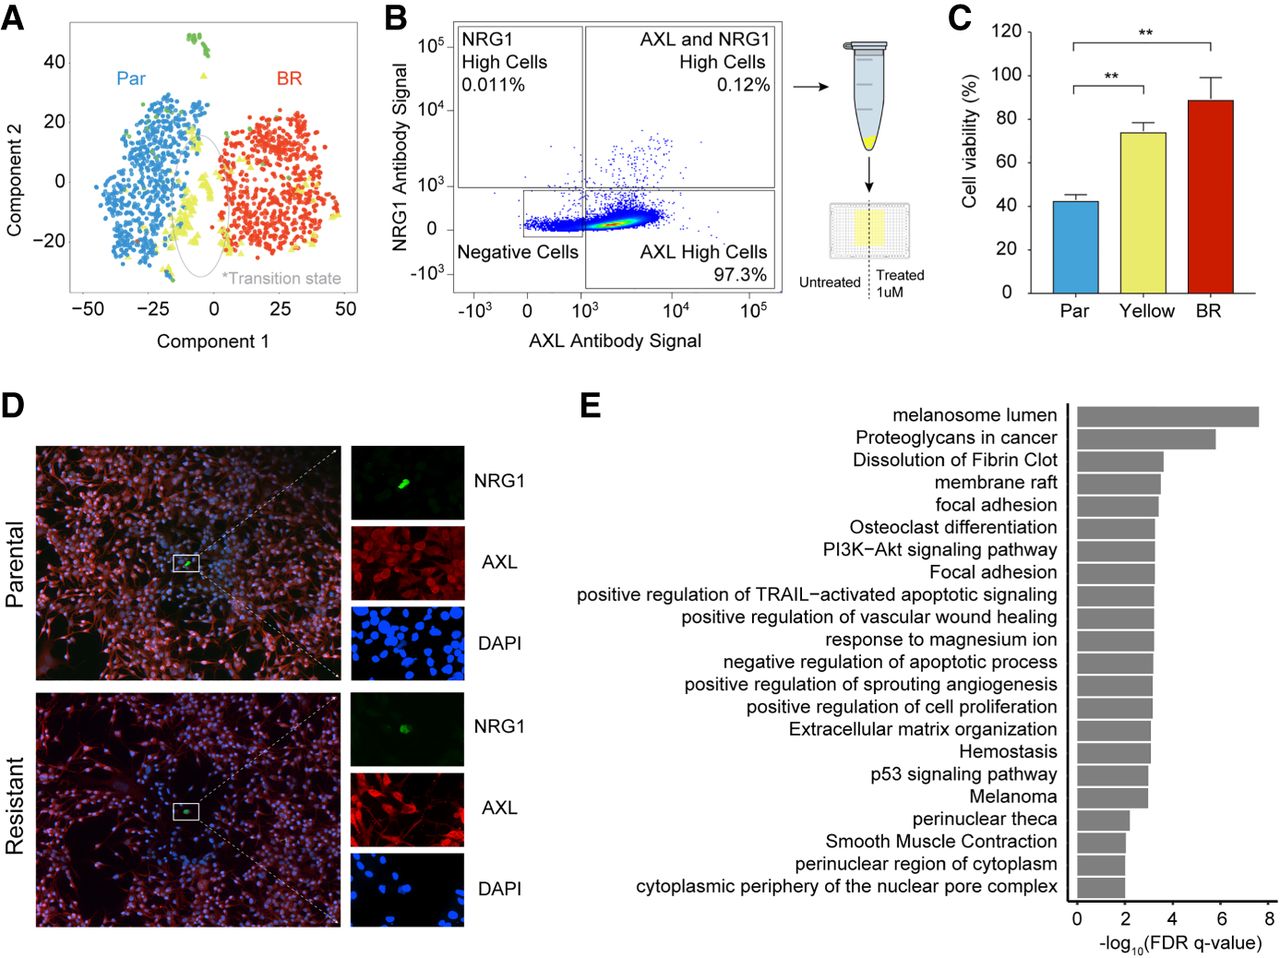
Transcriptome profiles identified an intermediate state between parental and resistant cells. (A) A t-SNE map displays SAKE-identified groups from the 10x data set of 451Lu cells. One group of cells (yellow) marked a potential transitional state during the acquisition of BRAFi resistance, present in both parental and BRAFi-resistant populations. (B) FACS analysis was used to identify cells doubly positive for two of the markers expressed in the proposed transitional state, NRG1 and AXL. These rare cells represented <1% of the 451Lu Parental population. (C) CellTiter-Glo assays were used to assess the BRAFi sensitivity of AXL/NRG1 doubly positive cells (yellow), which showed significantly increased survival in a 1 µM dose of BRAFi compared with the rest of the 451Lu Parental population (blue). (D) Confocal images of doubly positive AXL/NRG1 cells (green) show these cells are rare in both the 451Lu Parental and 451Lu BR populations. (E) Differentially expressed genes between cells in the transitional state and the rest of the 451Lu Parental cells were used for gene set enrichment analysis.


