
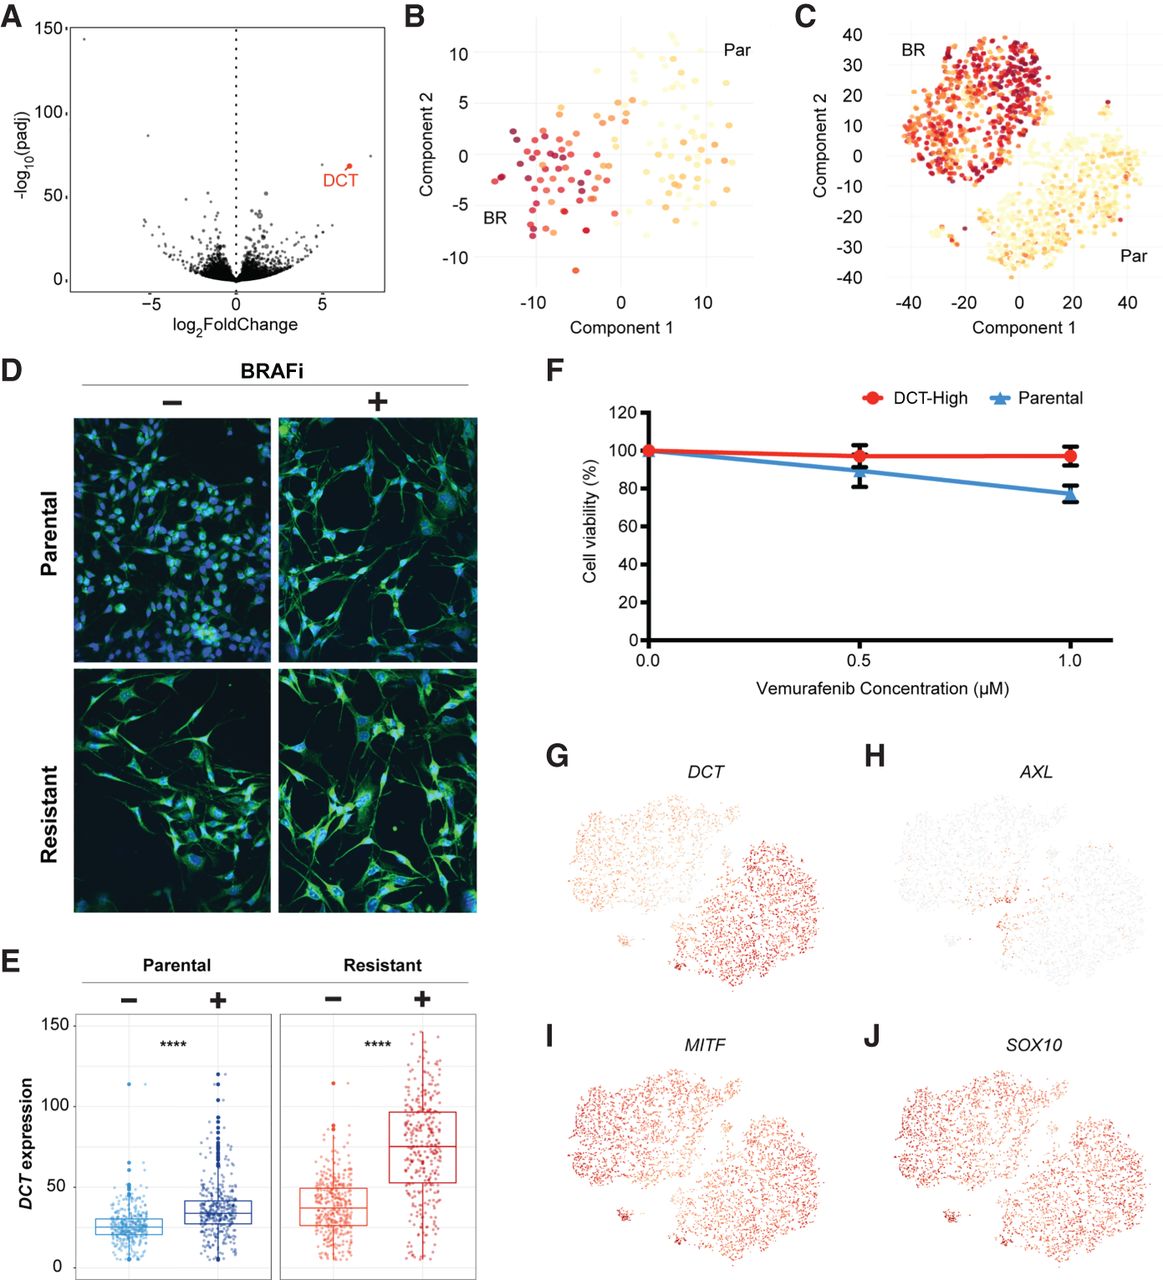
DCT marks 451Lu melanoma cells intrinsically resistant to BRAFi drug treatments. (A) A Volcano plot displays adjusted −log10(P-value) versus log2FoldChange between BRAFi-resistant and parental cells, which identified DCT as one of the strongest markers of the resistant population. t-SNE maps were used to display the DCT expression levels from data generated through Fluidigm C1 platform (B), and the 10x Genomics sequencing technologies (C). (D,E) Most of the resistant cells had higher levels of DCT compared with the parental cells. Cells were stained with a fluorescent-labeled DCT antibody (green) and counterstained with DAPI (blue). BRAFi-resistant cells show higher expression of DCT at the protein level, quantified in the box plots of E. (F) MTT assays measured metabolically active cells 48 h after application of BRAFi to the media. DCT-positive cells, isolated by FACS from the 451Lu parental population, show significantly reduced response to BRAFi and higher survival rates. (G) DCT shows a binary expression pattern, with high levels in BRAFi-resistant single cells. (H–J) Previously published markers of BRAFi resistance do not show similar binary expression patterns across cell populations.


