
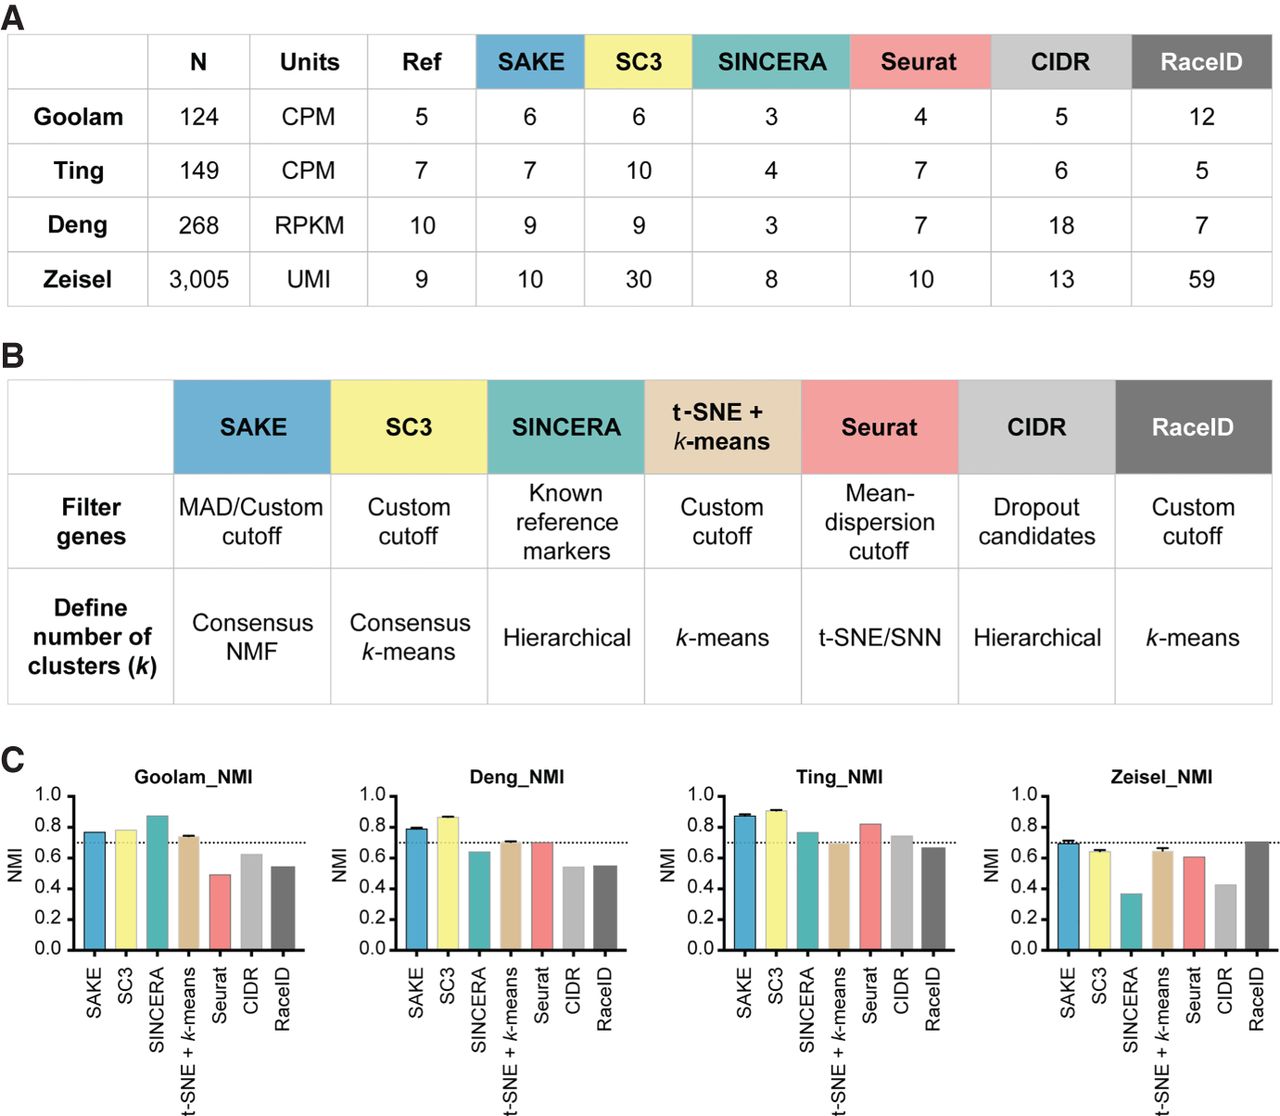
Data and performance summaries for scRNA-seq software. (A) The number of samples and reported clusters from five published clustering methods (SC3, SINCERA, Seurat, CIDR, and RaceID) compared with SAKE (blue). (B) Key features and techniques used by each method to perform gene filtering and to define the number of clusters. (C) Normalized mutual information (NMI) was used to compare the performance of each method on four published data sets in terms of the ability to recapitulate cluster assignments as given by the initial publication. Error bars were measured by subsampling 90% of the cells from each data set and iterating 1000 times to ensure robust results.


