
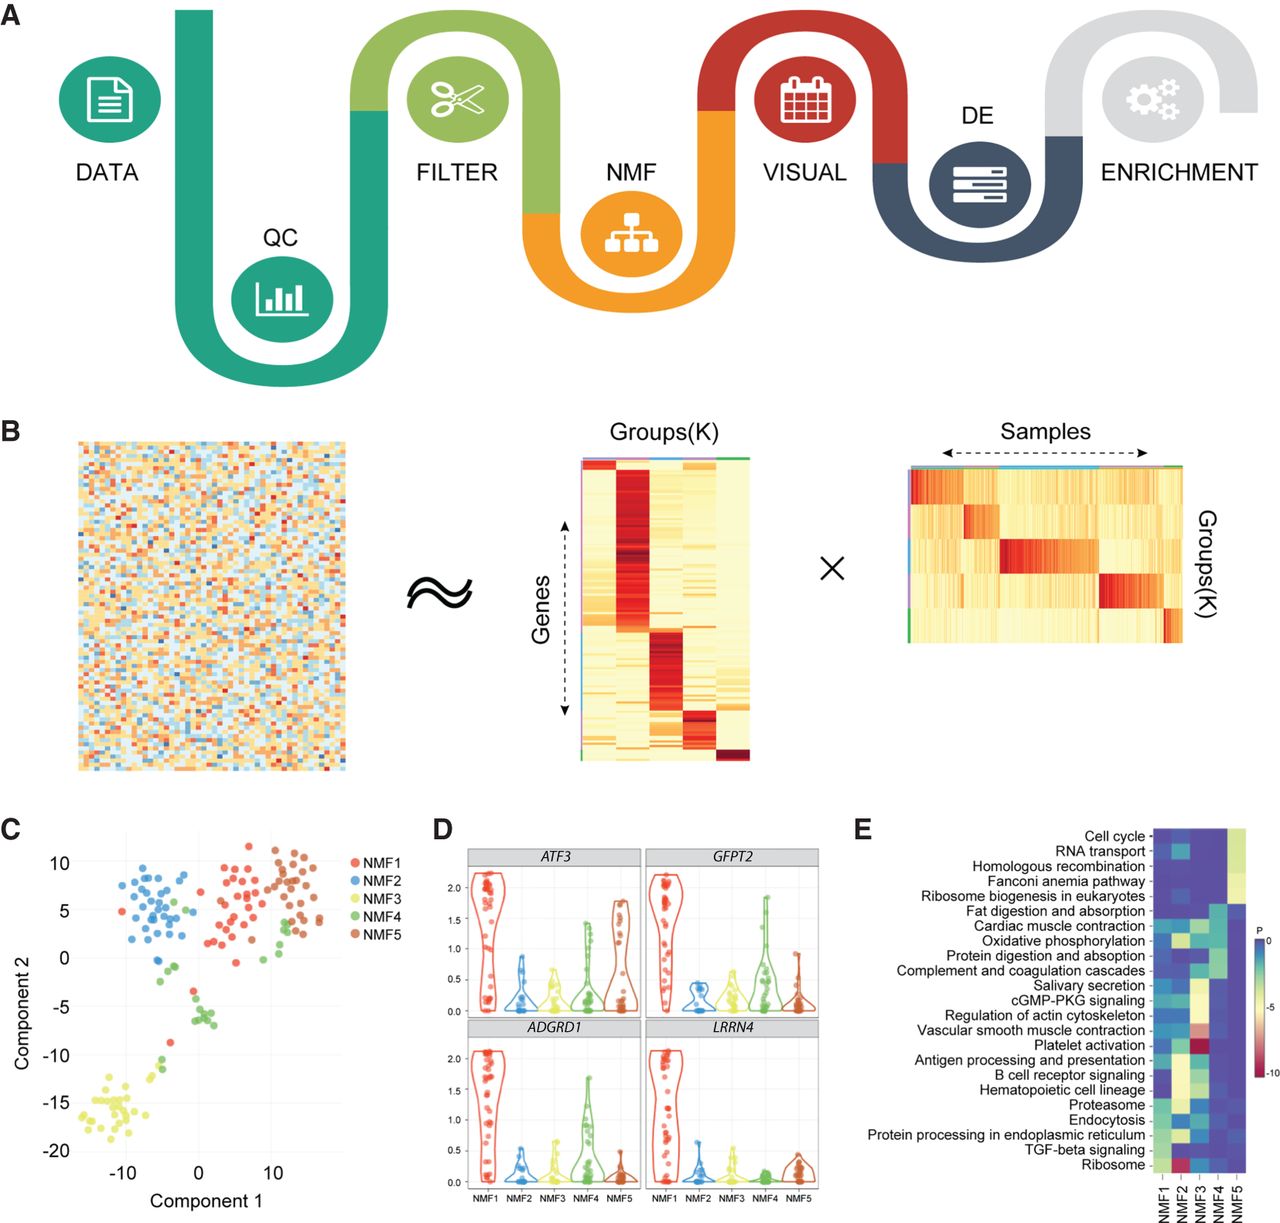
Figure 1.
Flowchart of SAKE package and example analysis results. (A) Analysis workflow for analyzing single-cell RNA-seq data. (B) A schematic representation of the non-negative matrix factorization (NMF) method shows heatmaps of sample assignment and feature extraction from NMF runs, with dark red indicating high confidence in cluster assignments. (C) A t-SNE plot to compare NMF-assigned groups with t-SNE projections. (D) A table of NMF-identified features (genes defining each cluster) and a box plot of gene expression distributions across NMF-assigned groups. (E) Summary table for GO term enrichment analysis for each NMF-assigned group.


