
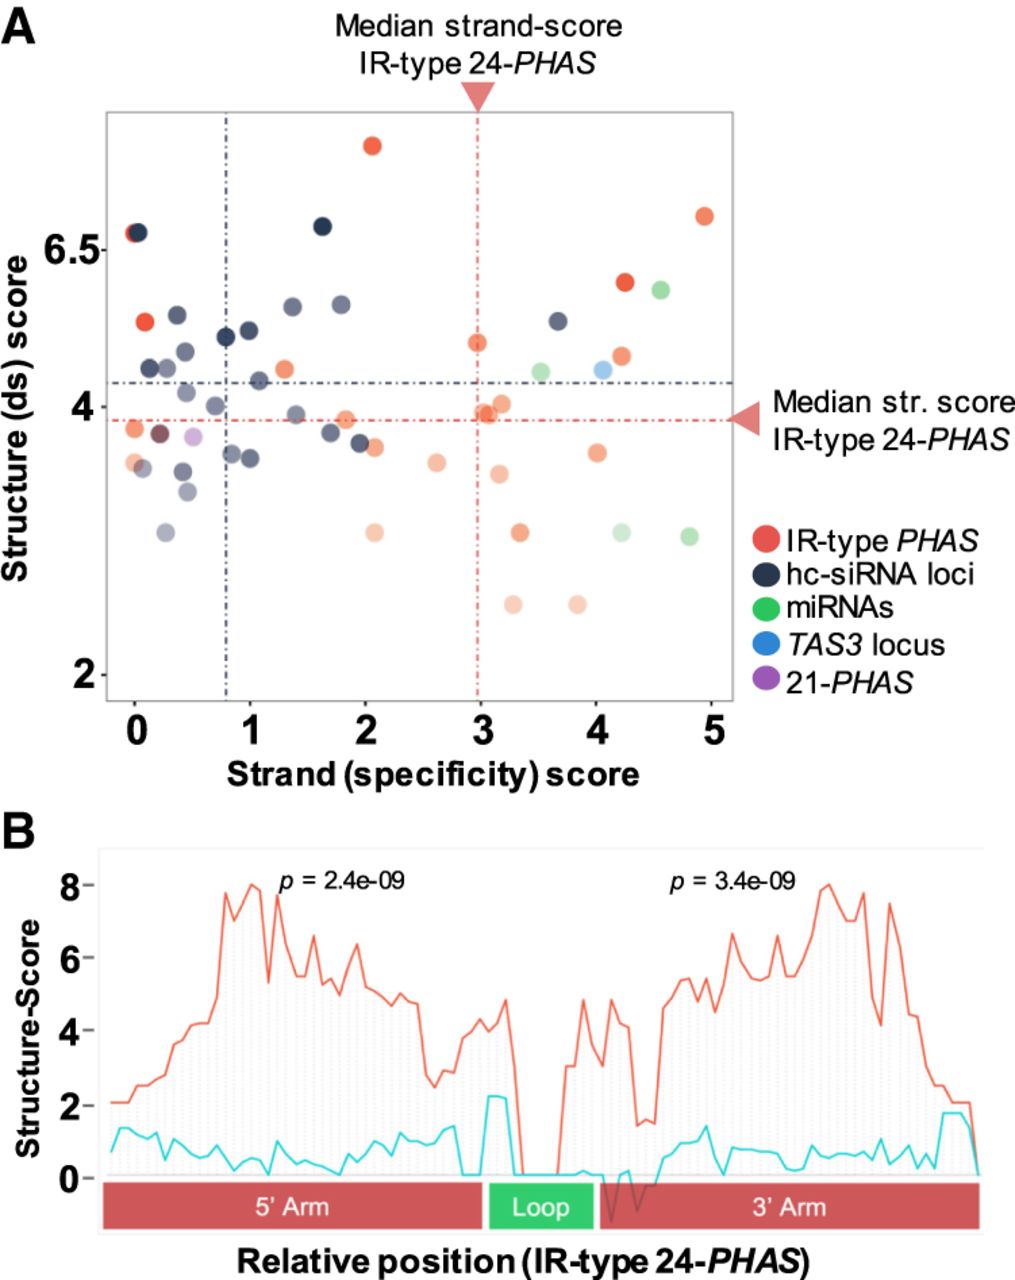
Intramolecular secondary structure at inverted repeat, 24-nt PHAS loci in Asparagus. (A) Scatterplots showing secondary structure scores as function of strand-specificity scores for IR-related loci along with randomly selected hc-siRNA, miRNA, tasiRNA, and IR-type 21-nt loci that passed the coverage cutoff. The dotted line represents score medians: (red) 24-nt PHAS loci; (blue) hc-siRNAs. (B) Consensus of dsRNA structure scores (red) from five IR-type PHAS loci show two statistically significant peaks of paired nucleotides and a “valley” (loop, green) of unpaired nucleotides validating formation of stem–loop structure from these IR-type PHAS transcripts. The five loci for this figure were selected based on high coverage and similar lengths and loop sizes. The control (blue line) represents the mean score from shuffled controls. Methods used to compute secondary structure scores are described in the Supplemental Methods.


