
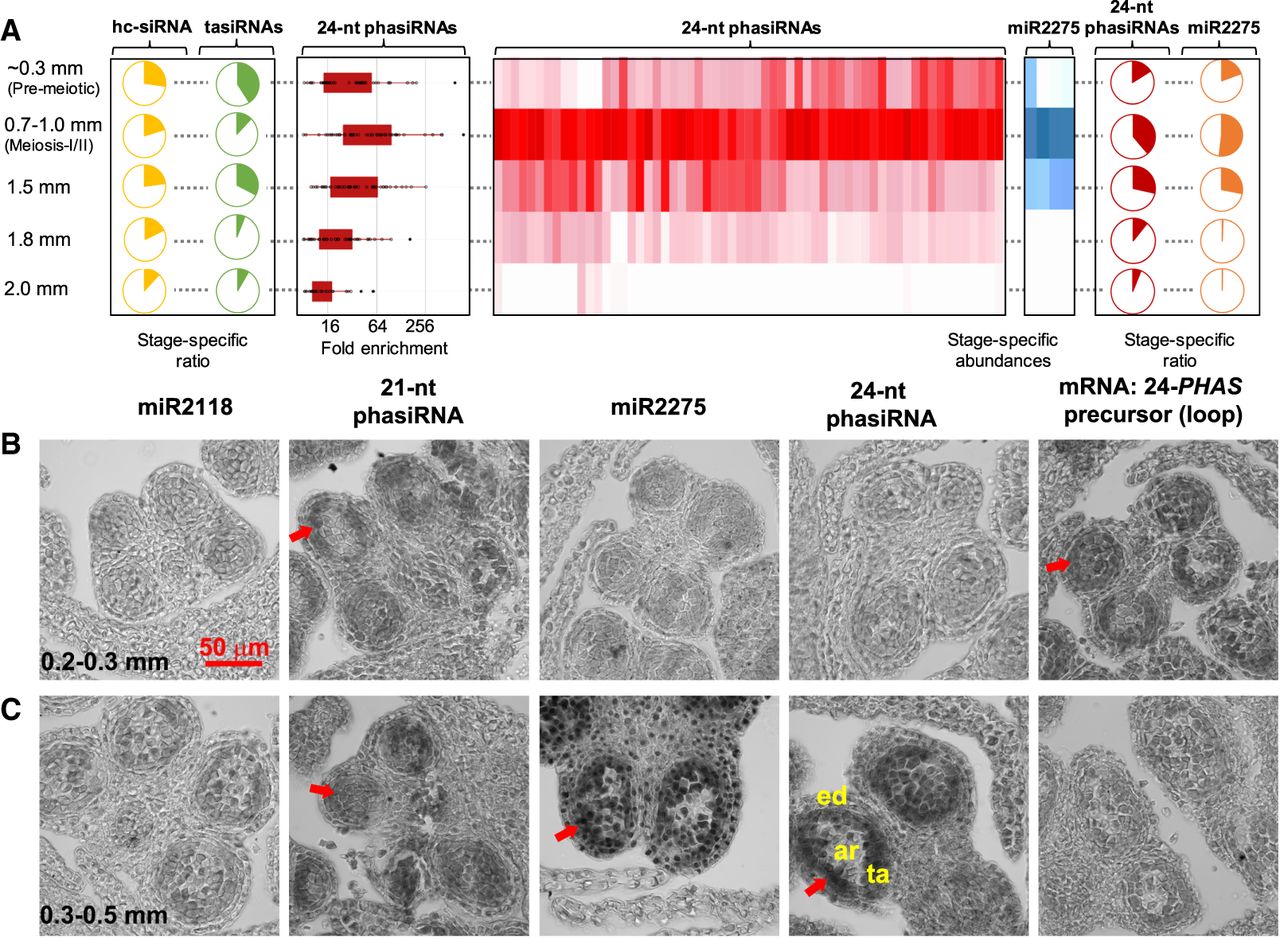
Reproductive phasiRNAs and their triggers in Asparagus. (A) Heat maps depicting abundance of 24-nt phasiRNAs (red) and their triggers, miR2275 (blue), in developing anthers. Both heat maps are clustered on their similarity of expression. Pie charts on the left or right represent the proportion of all small RNA abundances comprised by the 24-nt phasiRNAs (red), miR2275 (orange), hc-siRNAs (yellow), and TAS3 tasiRNAs (green) across anther developmental stages. The 24-nt phasiRNA accumulation pattern is distinct from both hc-siRNAs and TAS3 tasiRNAs. Box-whisker plots indicate enrichment (log2) of Asparagus 24-nt phasiRNA abundance from all PHAS loci in the meiotic anther compared to the vegetative sample (leaf). (B,C) Small RNA in situ hybridization with probes for the following, from left to right: (1) miR2118; (2) a premeiotic phasiRNA from locus 21-PHAS-9; (3) miR2275; and (4) a meiotic IR-related phasiRNA from locus 24-PHAS-31. The right-most images show mRNA in situ hybridizations with probes for the 24-PHAS-31 precursor. In each panel, signal is dark gray, and cell boundaries appear in light gray. Red arrows indicate small RNA signal. The locations of the epidermis (ed), tapetum (ta), and archesporial cells (ar) are indicated. The scale bar indicates 50 µm, for all images. (B) Images from premeiotic anthers, sized 0.2–0.3 mm. (C) Images from meiotic-stage anthers, sized 0.3–0.5 mm.


