
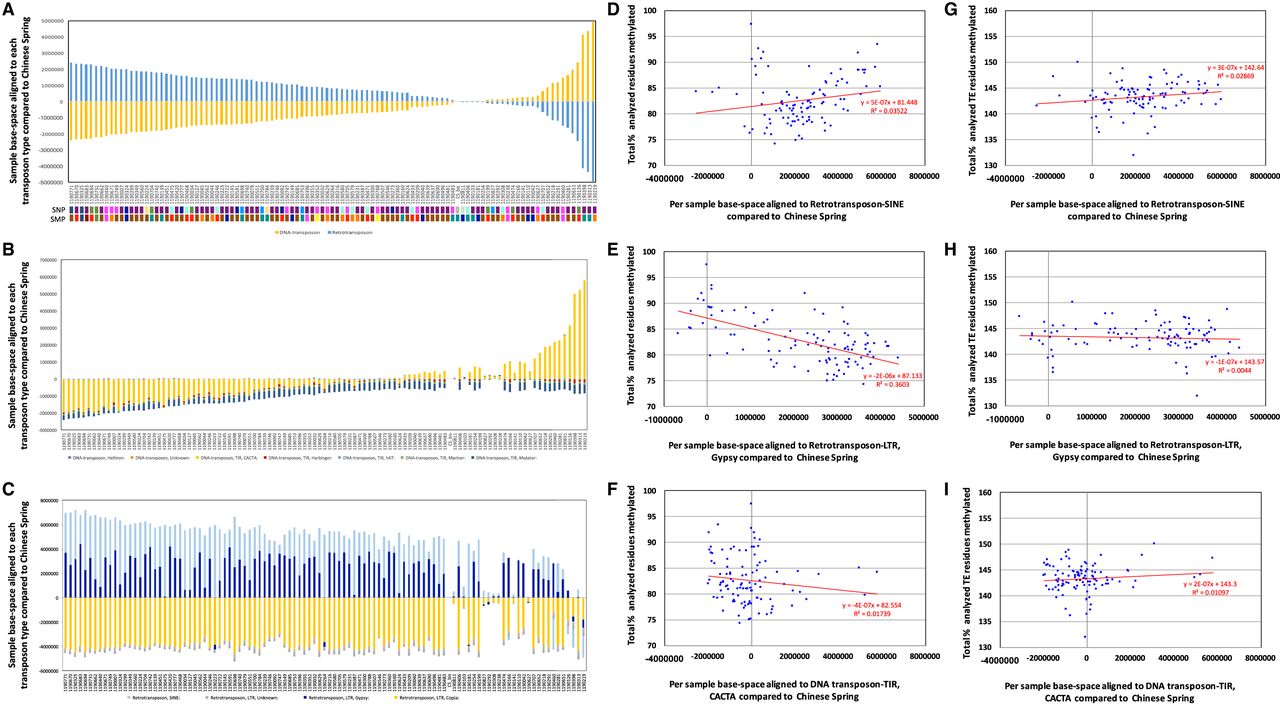
Analyzing transposable element methylation profiles across the Watkins collection. (A) Base-space per Watkins accession aligned to DNA-transposons and retrotransposons in comparison to Chinese Spring (Methods). (B) Base-space per Watkins accession aligned to DNA-transposons in comparison to Chinese Spring. (C) Base-space per Watkins accession aligned to retrotransposons in comparison to Chinese Spring. (D) Base-space per Watkins accession aligned to retrotransposon-SINE in comparison to Chinese Spring, plotted versus the total cumulative percentages of enriched cytosine residues (gene-associated) that were methylated for CpG, CHG, and CHH methylation. (E) as per D but for retrotransposon-LTR;Gypsy. (F) as per D but for DNA-transposon-TIR;CACTA. (G) Base-space per Watkins accession aligned to retrotransposon-SINE in comparison to Chinese Spring plotted versus the total cumulative percentages of TE-associated cytosine residues that were methylated for CpG, CHG, and CHH methylation. (H) as per G but for retrotransposon-LTR;Gypsy. (I) as per G but for DNA-transposon-TIR;CACTA.


