
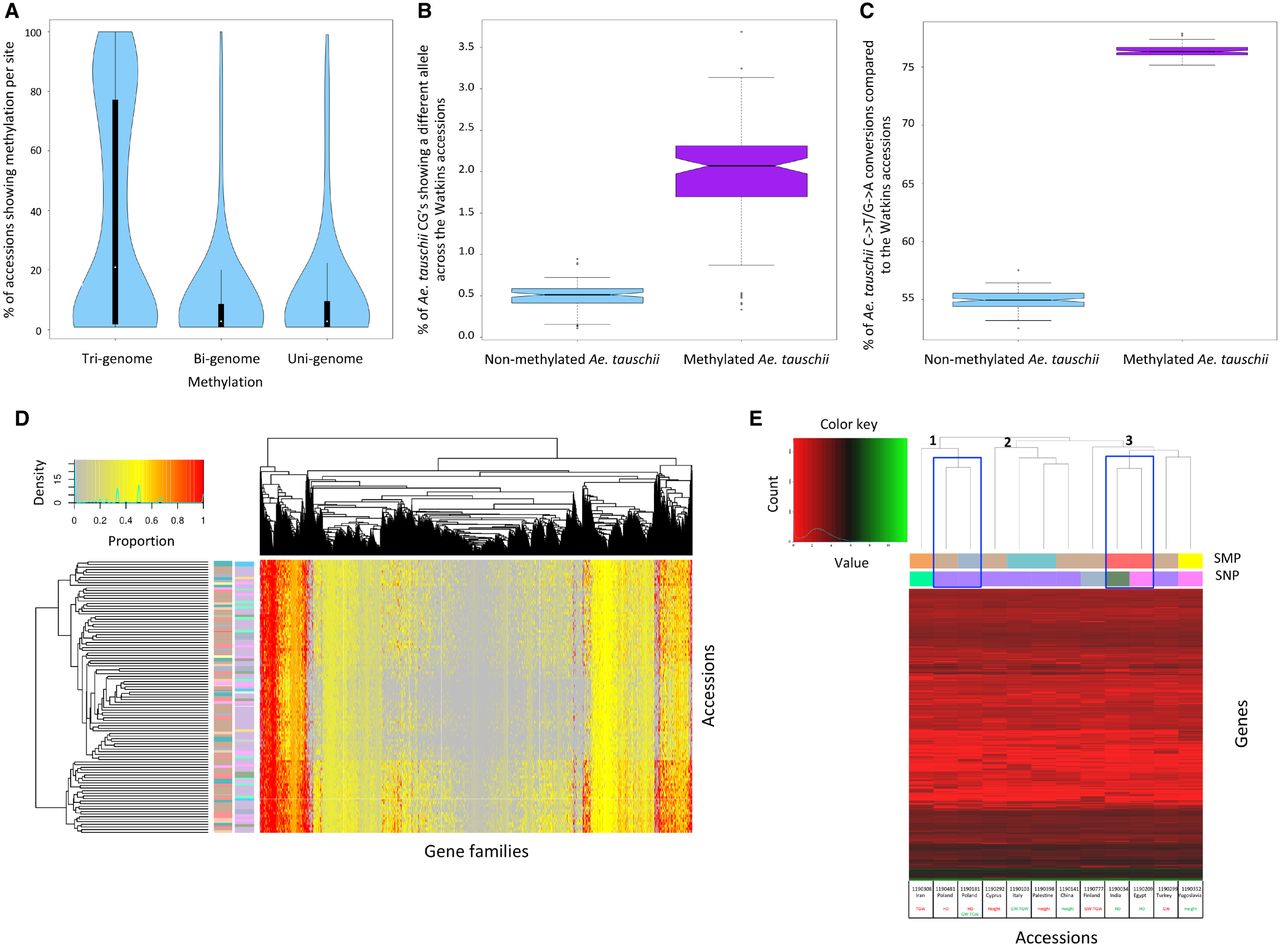
Analyzing methylation profiles across the Watkins collection. (A) Violin plots show the percentage of accessions showing methylation per site. Analyzed sites include Tri-genome, Bi-genome, and Uni-genome methylated sites. A comparative subset of 11,769 sites was used for each category. (B) Ancestral methylation associates with an increased SNP rate. The percentage of methylated versus nonmethylated Aegilops tauschii cytosines that show a different allele in Watkins. (C) Ancestral methylation demonstrates that 5-methylcytosines are preferentially deaminated to thymine. The percentage of methylated versus nonmethylated Ae. tauschii cytosines with a C-to-T/G-to-A transition across the Watkins collection. (D) Accession clustering based on the gene families targeted by methylation. Many accessions from the same geographical origin show the same gene families targeted by methylation and are, thus, clustered close to each other in the Accessions axis (vertical dendrogram). Alongside the vertical dendrogram, the two columns of row barcodes (left and right) correspond to the SMP clusters in Figure 1D and SNP clusters in Figure 1B, respectively. (E) Clustering of the 12 accessions subjected to RNA-seq using average gene expression across the replicates for genes showing differential expression between at least two lines (after log2 transformation). The horizontal dendrogram has its three main clades labeled 1, 2, and 3. Below the horizontal dendrogram, the two barcode rows (top and bottom) correspond to the SMP and SNP clusters in Figure 1, D and B, respectively. Accessions are labeled by line number, country of origin, and phenotype, i.e., TGW (thousand grain weight), HD (heading date), GW (grain width), or Height, with maximum values in green and minimum values in red. Accessions showing the phenotypic tails for heading date that are of interest within this study are highlighted on the horizontal dendrogram with a blue box.


