
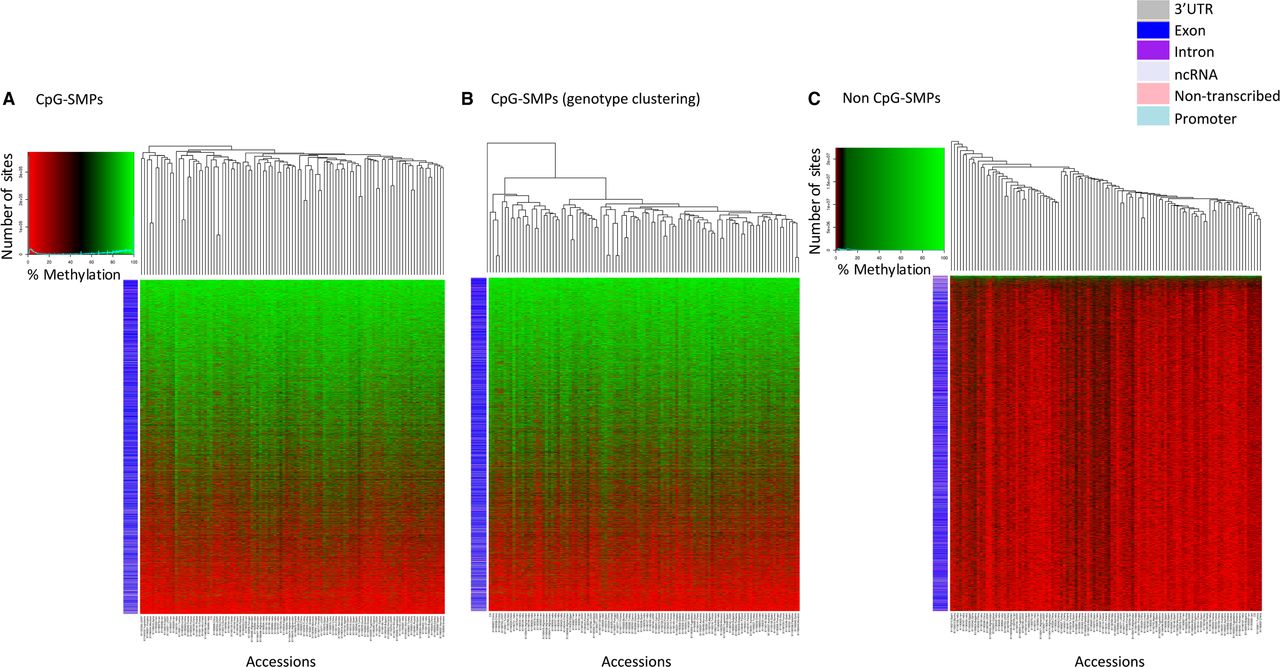
Visualizing methylation levels for the 105 wheat accessions across 359,500 SMP sites. Using sites with coverage in all 104 Watkins collection accessions plus Chinese Spring, we generated heat maps for methylation levels across (A) CpG-SMPs, (B) CpG-SMPs with accessions ordered by genotype using the heat map from A with accessions reordered based on Figure 1B's SNP clustering dendrogram (shown on top horizontal axis), and (C) non-CpG SMPs. Rows correspond to individual SMP sites and columns indicate accessions. The colored row labels (barcodes) on the left of the heat map indicate which genomic location a SMP falls into (see legend). SMP sites are ordered by their total methylation across the accessions on the vertical axes, and accessions are clustered by SMP profiles on the horizontal axes (Methods).


