
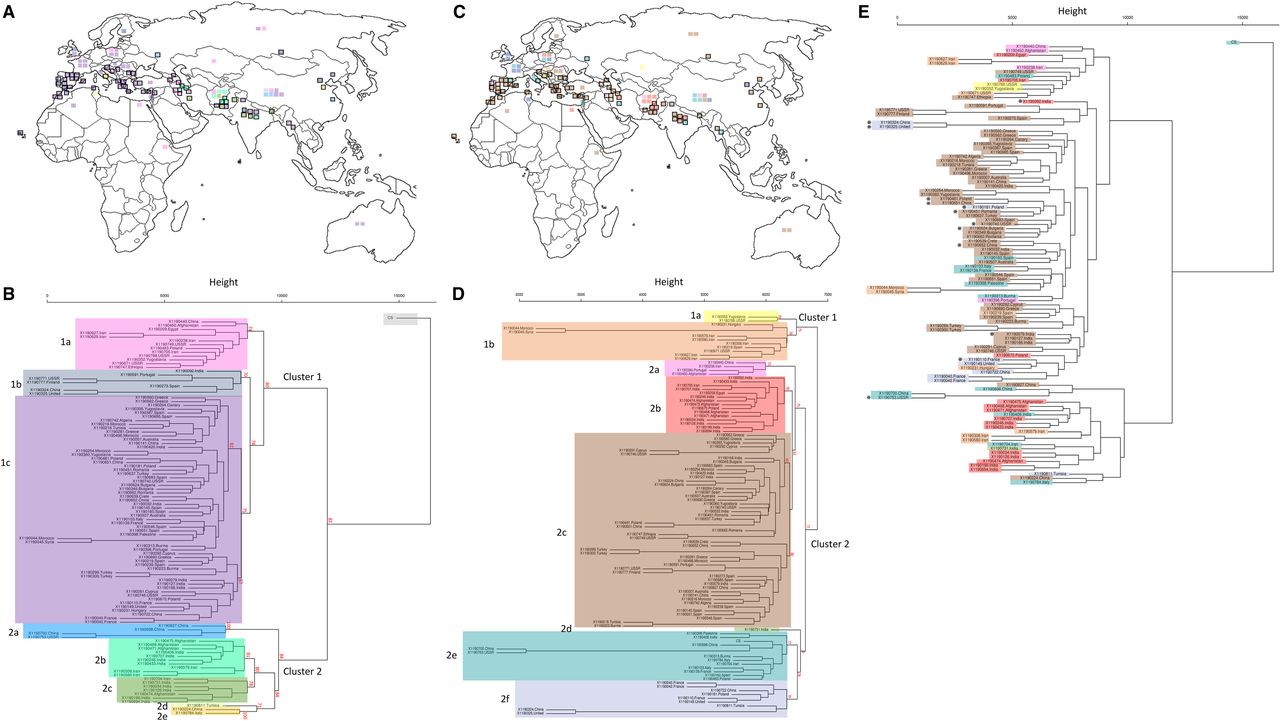
Geographical origins combined with hierarchical cluster analysis on 104 accessions from the Watkins core collection plus Chinese Spring wheat. (A) Geographical positions of the accessions color-coded by their allocated cluster from B after SNP hierarchical clustering. (B) Dendrogram constructed using the complete linkage method within the R package hclust to cluster accessions based on SNP allele frequency across 53,341 SNP sites. The tree was cut into eight groups (excluding the reference Chinese Spring) using the R package cutree, and these clusters are color-coded (Methods). (C) Geographical positions of the accessions color-coded by their allocated cluster from D after CpG SMP hierarchical clustering. (D) Dendrogram constructed using the complete linkage method within the R package hclust to cluster accessions based on methylation levels across 18,965 CpG SMP sites (taken from the 359,500 SMPs that were identified). The tree was cut into eight groups using the R package cutree, and these clusters are color-coded (Methods). (E) SNP-based dendrogram from B with individual accessions color-coded as per their cluster from the SMP-based dendrogram from D. For geographical accession positions in A and C, squares outlined in black represent accessions with detailed positional information that is used for plotting; squares with no outline represent accessions with only a country of origin. AU P-values were computed for the main clusters in B and D using the R package pvclust and are shown in red (Methods).


