
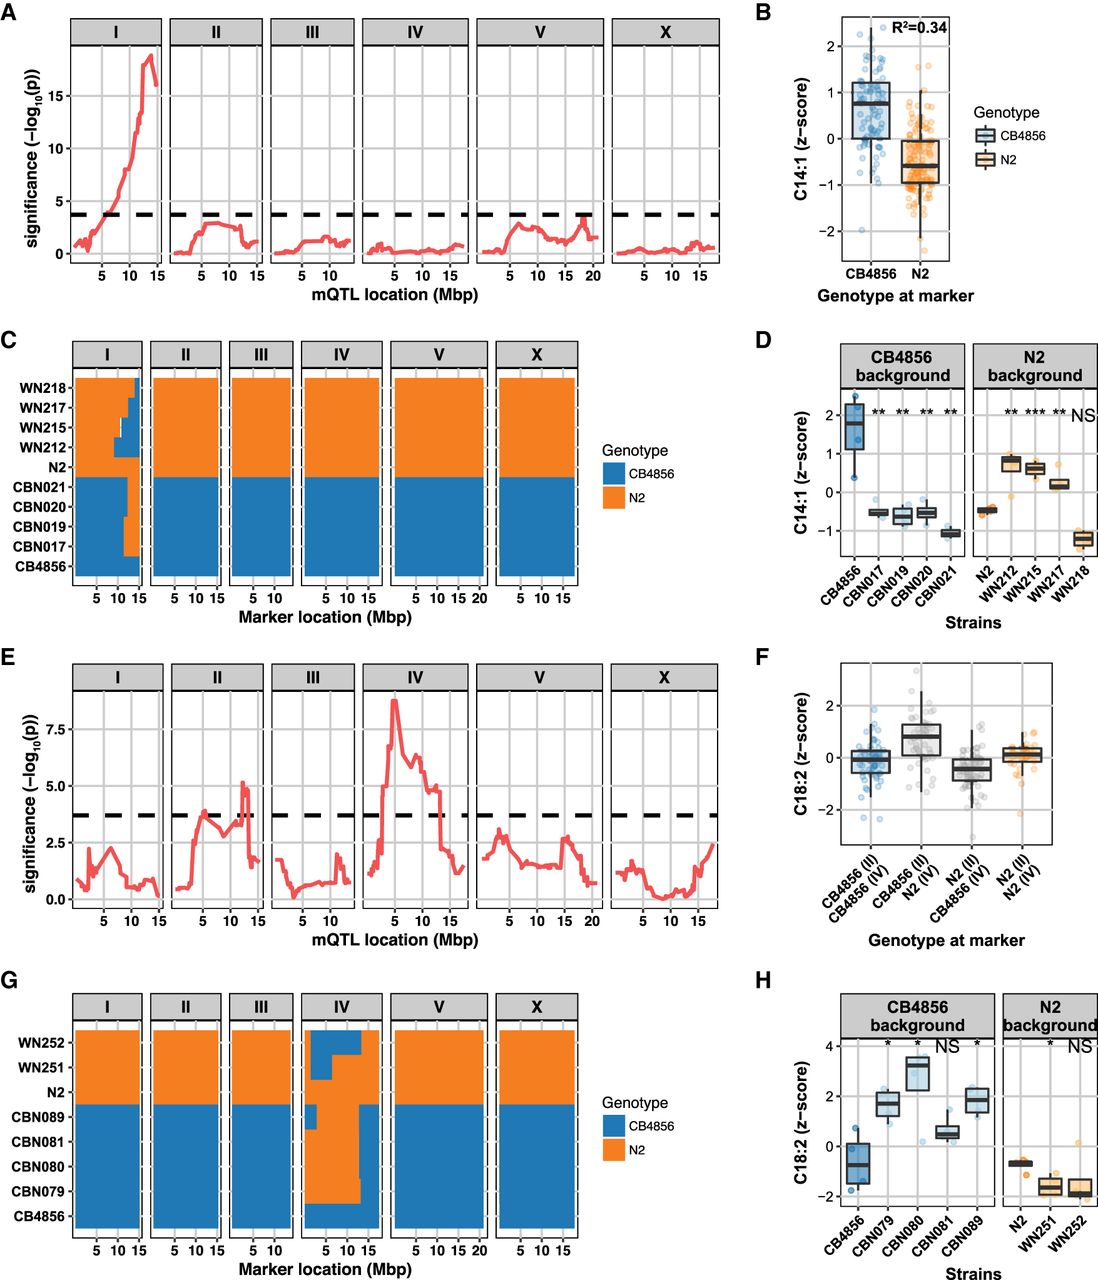
QTL peaks for C14:1 and C18:2 levels and narrowing down the QTL peak regions with ILs, respectively. (A) A strong QTL for C14:1 was detected on Chromosome I (the dashed line indicates FDR = 0.05 threshold). (B) The genetic variations attributed to a QTL were calculated by the correlation between the metabolite level and the genotype at the peak location. RILs that have a CB marker at this locus have a relatively higher abundance of C14:1 compared to those that have an N2 marker. Thirty-four percent of the variation in FA C14:1 levels can be explained by genetic variation on Chromosome I. (C) Genotypes of the ILs with either a CB4856 background or an N2 background. The genome of an IL is composed of a recipient genome contributed by one of the parental strains and a short homozygous segment of the genome contributed by the other parental strain. WN212, WN215, WN217, and WN218 strains are ILs with an N2 background, and CBN017, CBN019, CBN020, and CBN021 are ILs with a CB4856 background. Genomic segments from N2 are marked with orange; those from CB4856 are marked with blue. (D) Metabolite profiles of ILs and two parental strains. CB4856 has higher levels of C14:1. All CBN lines have lower levels than CB4856 (metabolite levels were normalized to percentage z-score), meaning that there is a QTL covered by all of these lines; same for all WN lines, only WN218 has a lower level than N2. Therefore, this strain does not contain the QTL. The WN ILs narrow the QTL for C14:1 down to a region of 12.42–13.84 Mbp. (E) Two QTL were detected for C18:2: One QTL peak was detected on Chromosome II and one on Chromosome IV (the dashed line indicates FDR = 0.05 threshold). (F) RILs that have an N2 marker at the locus on Chromosome IV have a relatively higher abundance of C18:2 compared to those that have a CB4856 marker. Twenty-seven percent of the variation in the FA C18:2 level can be explained by genetic variation on Chromosomes II and IV. (G) Genotypes of the ILs with either a CB4856 background or an N2 background. CBN079, CBN080, CBN081, and CBN089 are ILs with a CB4856 background, and WN251 and WN252 strains are ILs with an N2 background. Genomic segments from N2 are marked with orange; those from CB4856 are marked with blue. (H) FA profiles of ILs and two parental strains. Three of the CBN lines have higher levels than CB4856 (metabolite levels were normalized to percentage z-score), and one of the two WN strains confirmed the mQTL for C18:2. The mQTL could be confirmed to a region of 2.8–6.4 Mbp. Significance was calculated using Student's t-test and corrected for multiple testing. (*) q < 0.05; (**) q < 0.01; (***) q < 0.001; (NS) not significant.


