
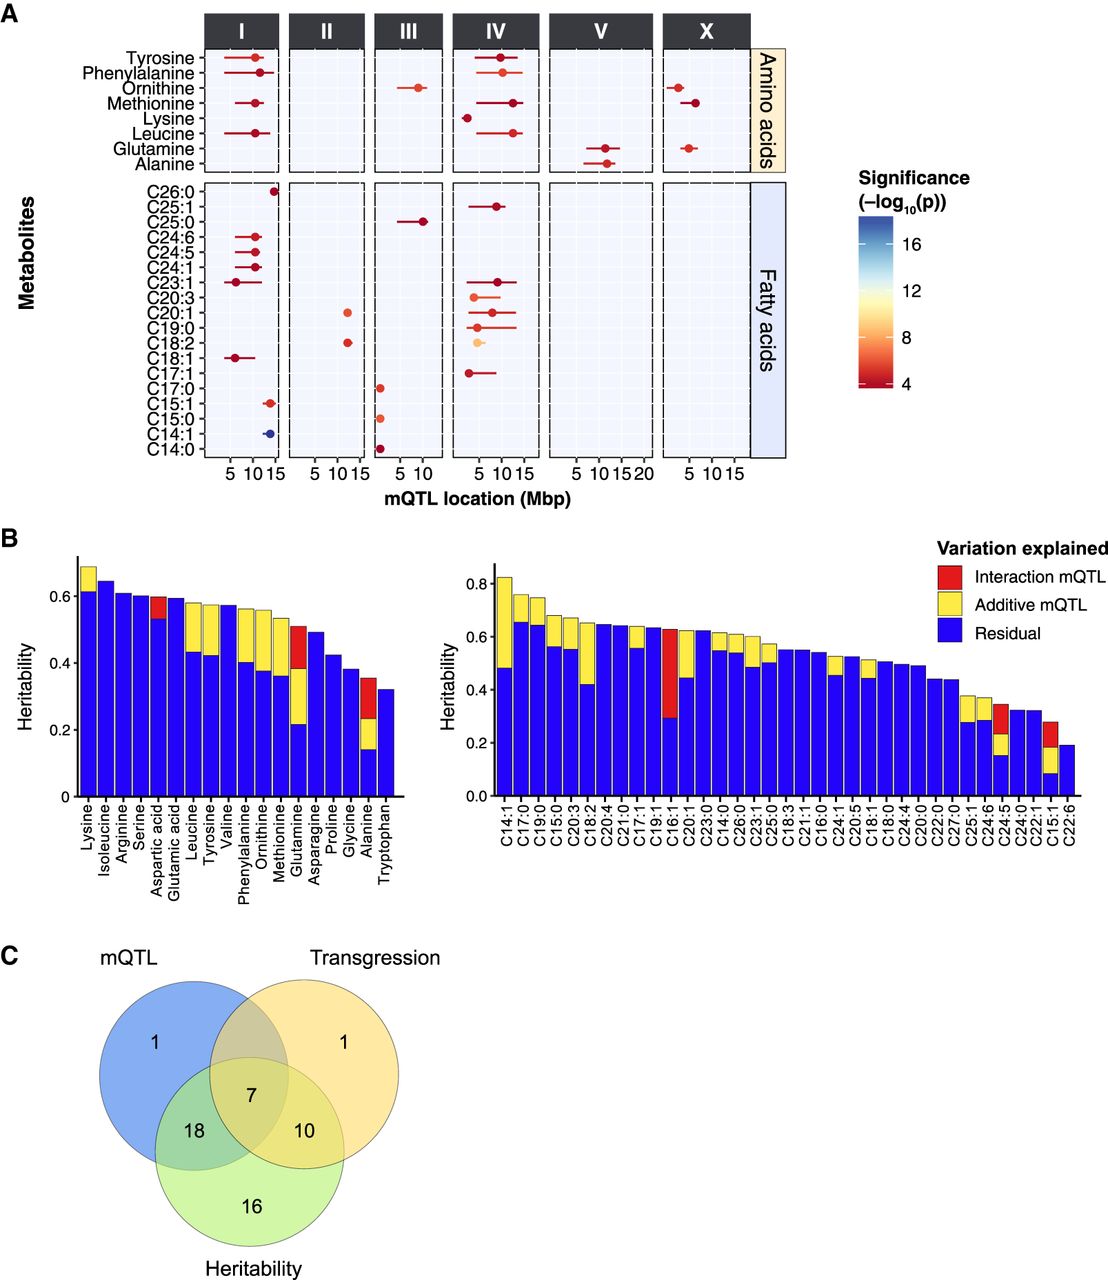
QTL mapping of metabolite levels in the 199 RILs. (A) To identify genetic factors responsible for the observed metabolite trait variations, we performed QTL mapping with the metabolite profiles of 199 RILs. In total, 36 significant mQTL were detected for AA and FA traits at an FDR = 0.05 [−log(p) > 3.7], ranging from 4.2 to 16.5 (Supplemental Table S7). The x-axis displays the position of the QTL in mega base pairs (Mbp) for each chromosome, and the y-axis displays the trait for which a significant QTL was found. (B) The heritability of each metabolite and the amount of variation explained by identified mQTL. Two classes of mQTL are distinguished: additive loci and locus–locus interactions. (C) Overlapping metabolite traits that are identified in QTL mapping, heritability analysis, and transgressive segregation analysis. Except for one metabolite trait (C15:1), all metabolite traits that were mapped to one or more significant QTL were highly heritable. Seven transgressive metabolite traits appeared to be associated with one or more significant QTL. These seven traits also have significantly higher heritability.


