
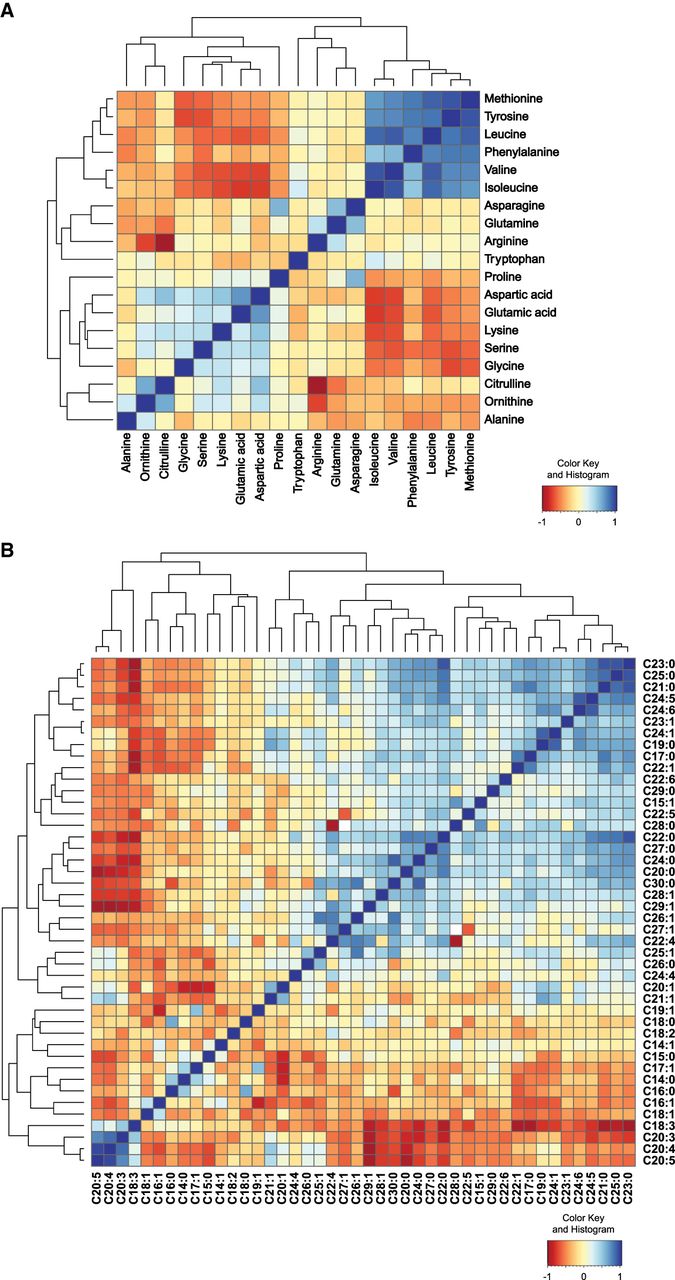
Correlation analysis of AA and FA species in the RIL strains. (A) Correlation heat map of AA profiles of all the RIL strains. There was a strong cluster of methionine, tyrosine, phenylalanine, arginine, and branched-chain amino acids (BCAAs) leucine, isoleucine, and valine. Another positively correlated cluster was found in ornithine, citrulline, glycine, serine, lysine, glutamic acid, and aspartic acid. The former positive cluster was negatively correlated with some AAs from the latter cluster, including proline, aspartic acid glutamic acid, lysine, serine, and glycine. (B) Correlation heat map of FA profiles of the RILs. Strong correlation was found in a group of long-chain and very-long-chain FAs. Polyunsaturated fatty acids (PUFAs) were also clustered and positively correlated.


