
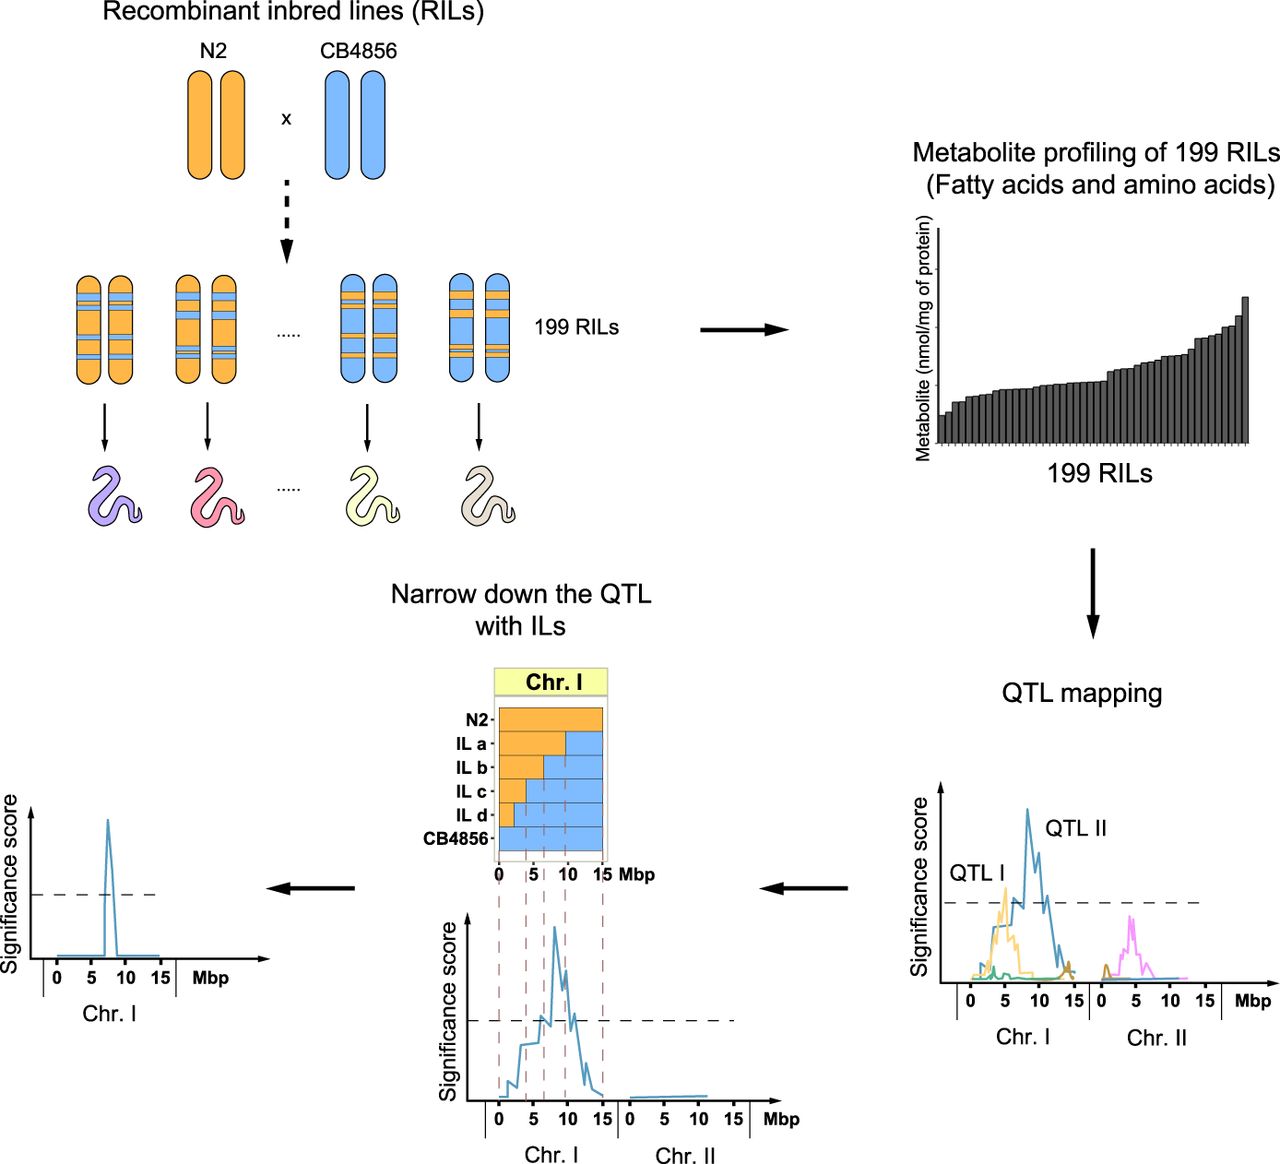
Flowchart of the strategy to identify genetic loci that control metabolic traits. Metabolite profiles for 19 amino acids (AAs) and 44 fatty acids (FAs) were measured in 199 recombinant inbred lines (RILs). These metabolite profiles were plotted and correlated with the RIL genetic map, identifying genetic loci linked to variation in metabolite levels (metabolite quantitative trait loci, mQTL). Subsequently, these mQTL were verified/confirmed and fine-mapped using introgression lines (ILs), strains containing a small locus of one parental strain in the genetic background of the other parental strain ([N2] orange; [CB4856] blue).


