
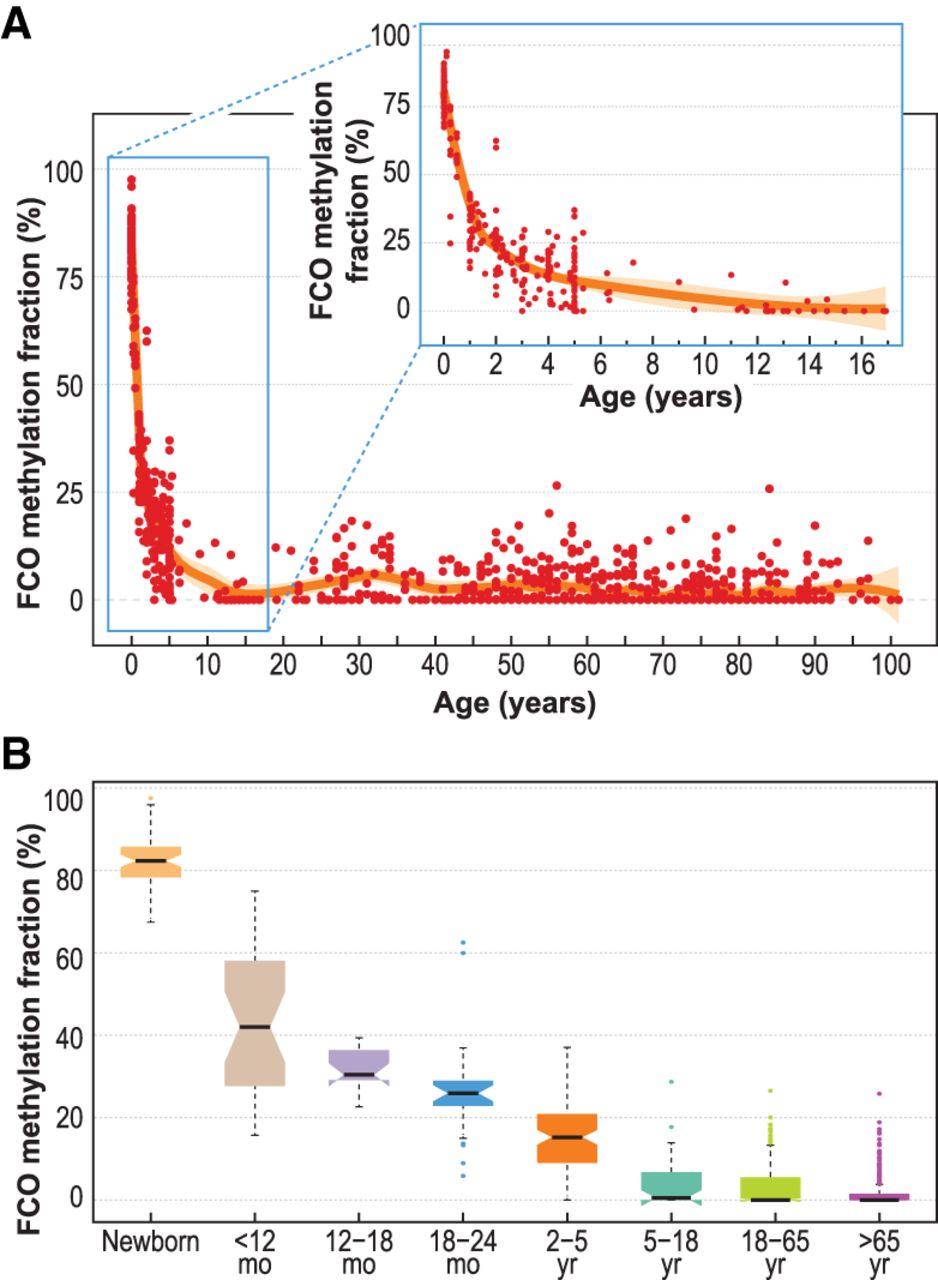
FCO methylation signature deconvolution in blood leukocytes sampled at birth through childhood and adult ages. Panel A shows the loess smoothing curve across different ages ranging from newborn to 101 yr. In the top subplot of the panel is an enlarged depiction of the marked decrease of the fraction of cells showing the FCO signature during the first 18 yr of life. Panel B summarizes the reduction of the FCO signature at different age intervals. In the boxplots: (1) The box shows the interquartile range (IQR), (2) the whiskers show the inner fences (1.5 × IQR out of the box), (3) the bolded line shows the median of the data, and the notches-horns display the 95% confidence interval of the median.


