
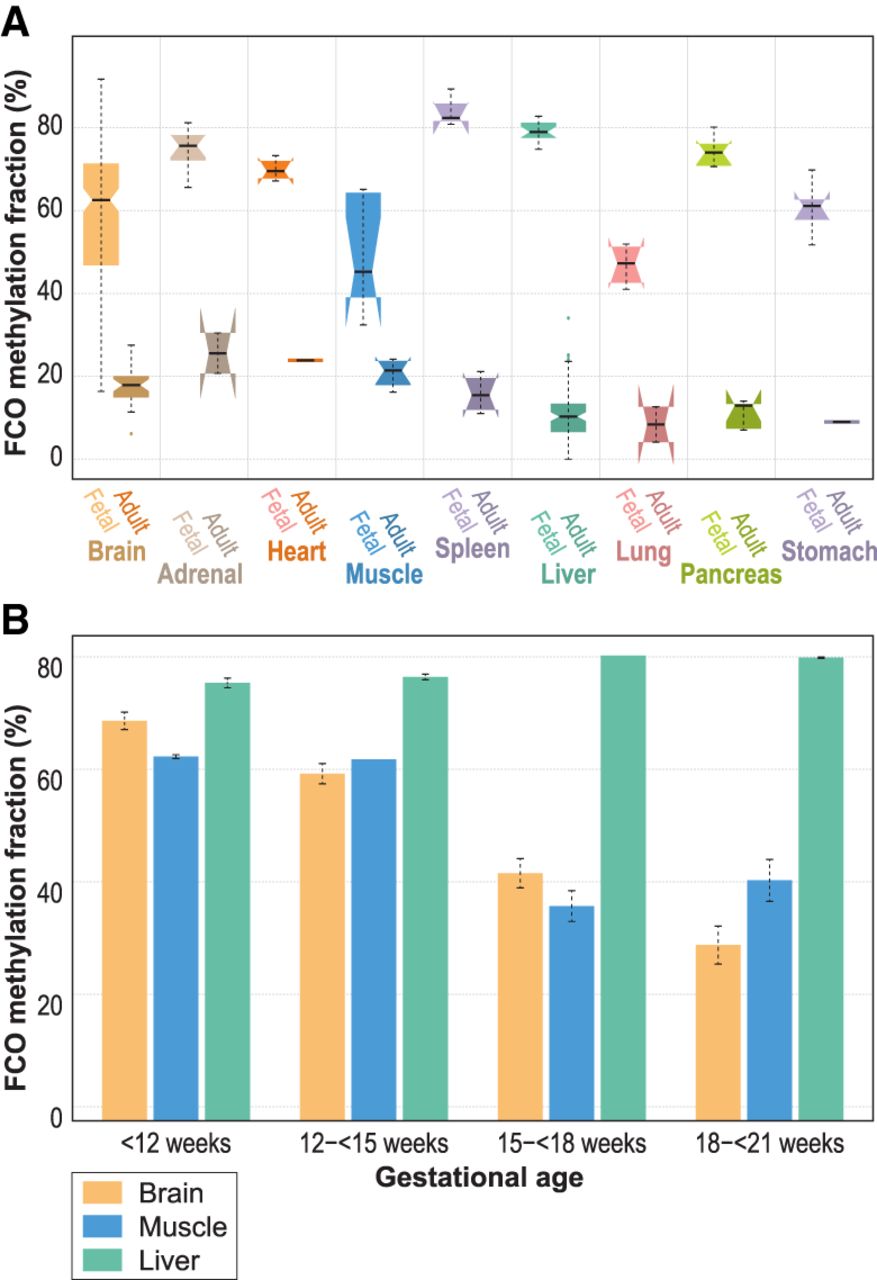
FCO methylation signature deconvolution in fetal/embryonic and adult tissues. Panel A compares the estimated FCO methylation fraction between fetal/embryonic and adult tissues. In the boxplots: (1) The box shows the interquartile range (IQR), (2) the whiskers show the inner fences (1.5 × IQR out of the box), (3) the bolded line shows the median of the data, and the notches-horns display the 95% confidence interval of the median. Panel B compares the estimated mean FCO methylation signature in three fetal/embryonic tissues in four gestational periods: Brain and muscle showed a marked reduction of the signature after the 15th week of gestational age. In contrast, fetal/embryonic liver showed a persistently high level of the FCO signature.


