
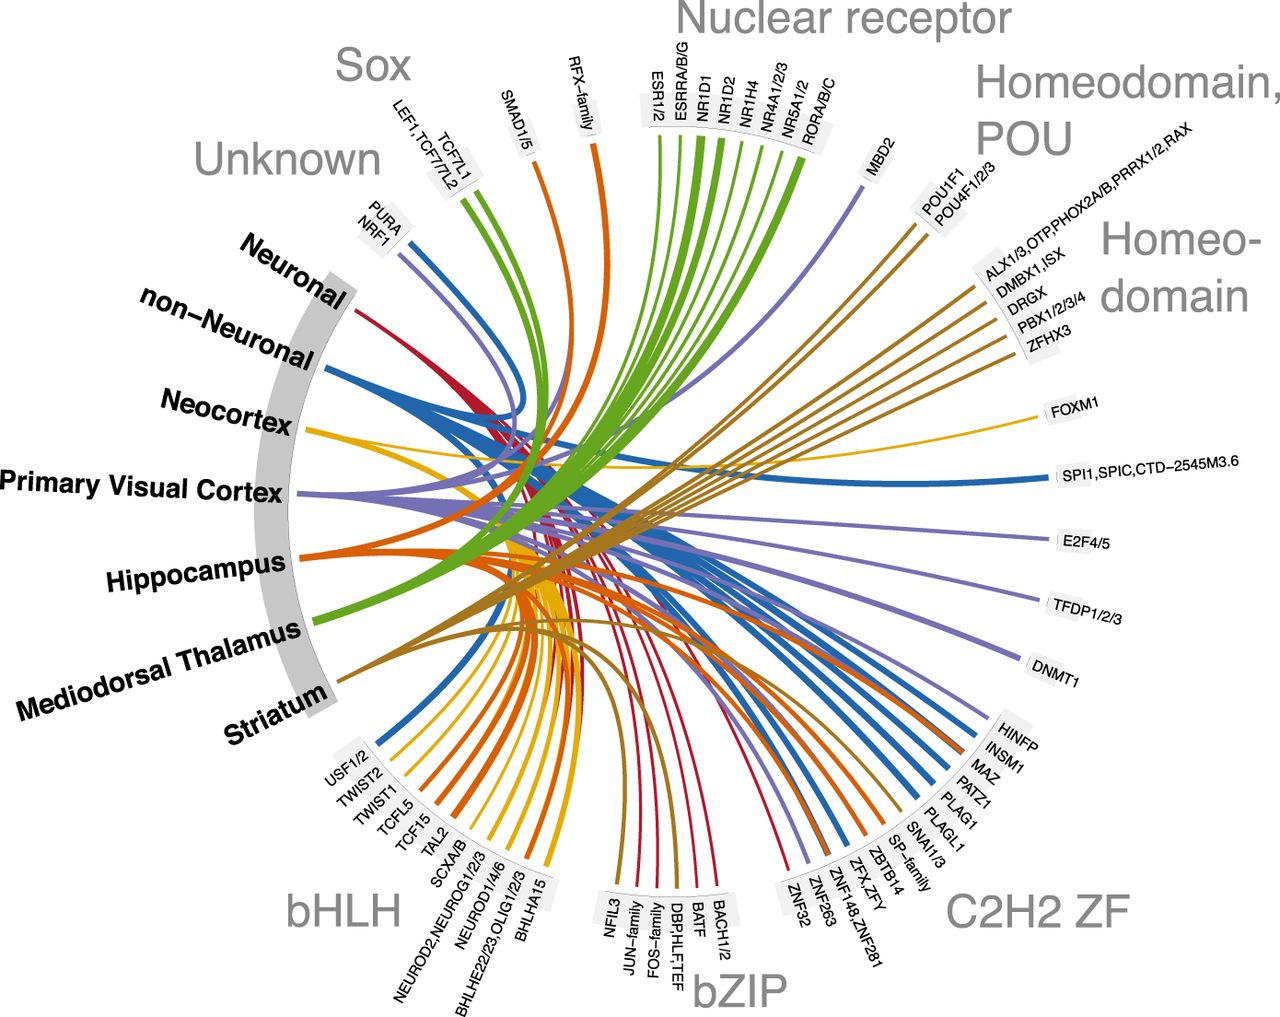
Figure 7.
The top 10 transcription factor binding motifs showing the highest fold enrichment of footprinted binding sites within peaks specific to a given cell type or brain region compared to all peaks. The region-specific TFs are based only on neuronal samples. TF binding motifs are grouped by TF family, and line width indicates the log2-transformed fold enrichment. All shown enrichments were statistically significant after correcting for multiple testing in a one-sided binomial test. Similar plots of TF binding motif enrichments stratified by genomic context are shown in Supplemental Figure S24.


