
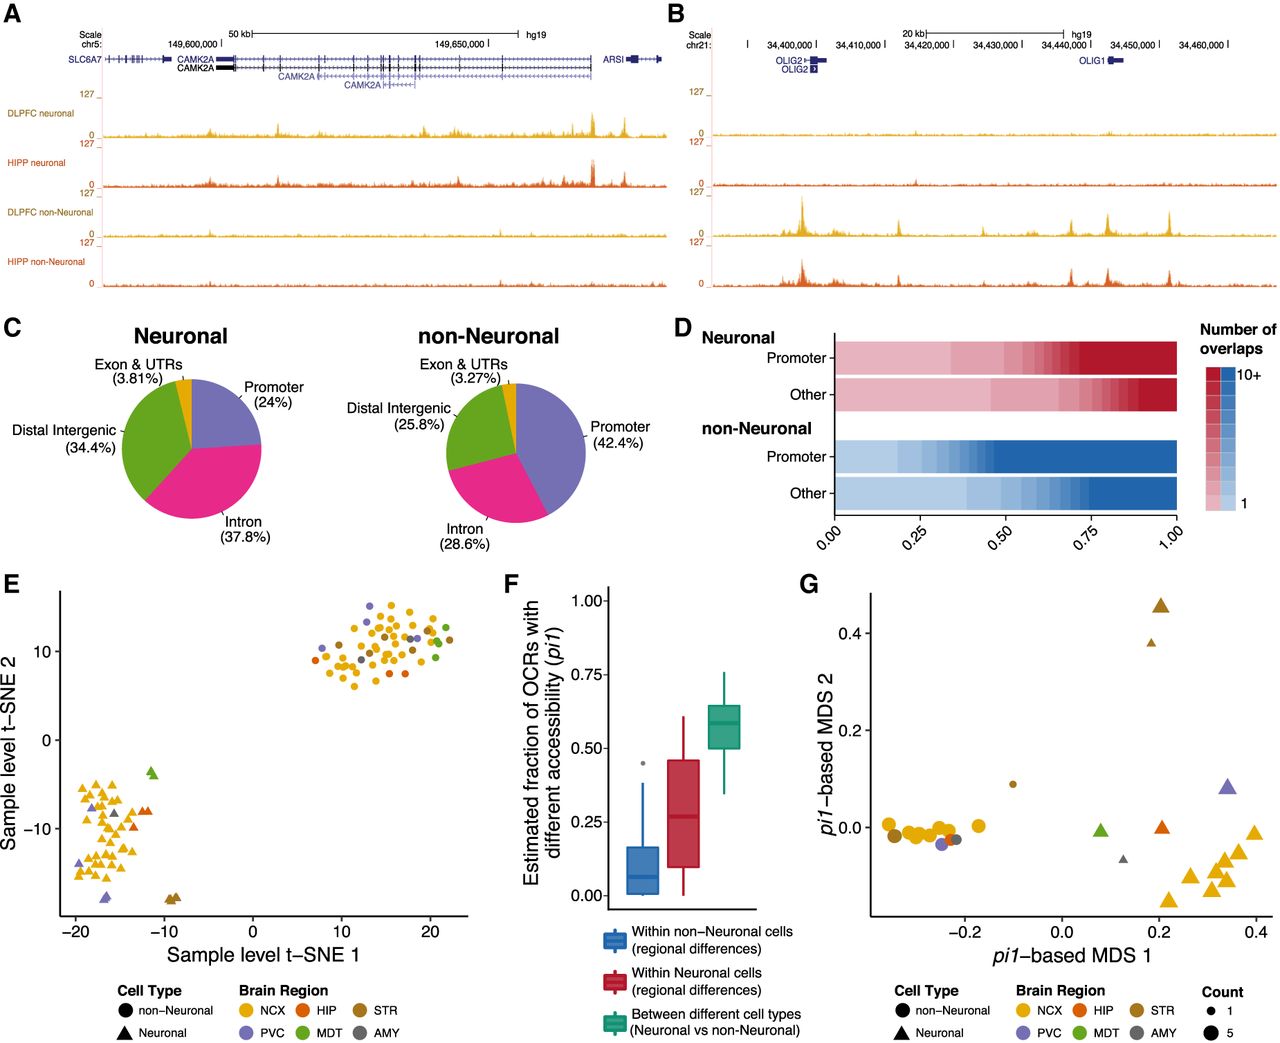
Comparisons between neuronal and non-neuronal OCRs of various brain regions. Representative cell-type–specific open chromatin tracks in the dorsolateral prefrontal cortex (DLPFC) and hippocampus at known neuron-specific (CAMK2A) (A) and non-neuron-specific (OLIG1 and OLIG2) genes (B). (C) Neuronal and non-neuronal OCRs show distinct distribution of genomic contexts. OCRs within 3 kb of a TSS were considered as promoter OCRs. (D) The distribution of the number of brain regions in which a consensus OCR was found, stratified by cell type and promoter/nonpromoter OCRs. OCRs within 3 kb of a TSS were considered as promoter OCRs. (E) Clustering of the individual samples (n = 115) using t-SNE. Brain regions are grouped in six broad areas: (AMY) amygdala; (HIP) hippocampus; (MDT) mediodorsal thalamus; (NCX) neocortex; (PVC) primary visual cortex; (STR) striatum. (F) Distribution of statistical dissimilarity (quantified based on the proportion of true tests, pi1) for inter- and intra-cell-type pairwise comparisons. Larger pi1 indicates a larger fraction of OCRs estimated to be different between samples based on pairwise comparisons. (G) Multidimensional scaling of brain regions and cell types (n = 28) using the pi1 estimates of statistical dissimilarity as distance. Same abbreviations as in E. The MDT non-neuronal group is immediately adjacent to, and partly obscured by, the leftmost non-neuronal striatum group.


