
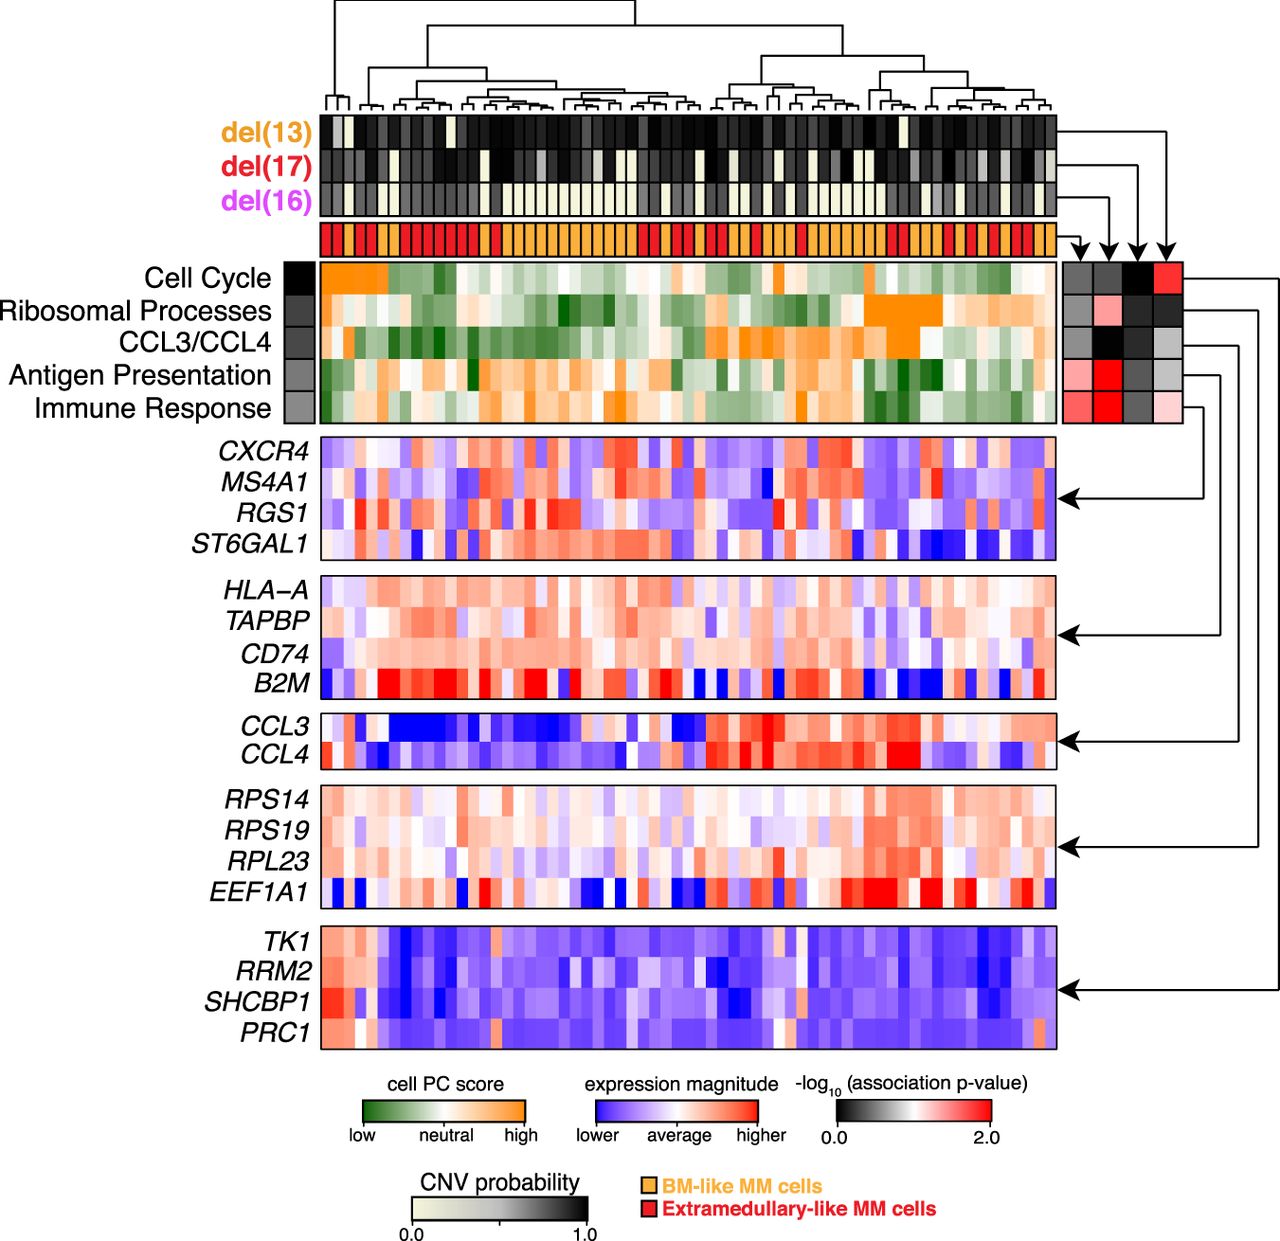
Pathway and gene-set overdispersion analysis of MM34. Unbiased transcriptional analysis of the initial bone marrow biopsy sample (MM34). Hierarchical clustering of cells (columns) is shown based on their overall transcriptional similarity. Top five most significant (P-value <0.05) aspects of transcriptional heterogeneity (rows) are shown by the green–orange heatmap in the center. Expression patterns of subsets of genes underlying each identified aspect of transcriptional heterogeneity are shown in the blue–red heatmaps below. Top panels show posterior probabilities of different deletions, and the consensus similarity to the extramedullary dissemination for each cell. Correspondence of different transcriptional subpopulations to the underlying subclonal structure is shown by the association heatmap (right; black–red). In particular, strong correspondence is observed between genetic subclones and the immune response aspect of transcriptional heterogeneity. However other, more prominent transcriptional subpopulations (CCL3/CCL4, antigen presentation) appear independently of the subclonal structure.


