
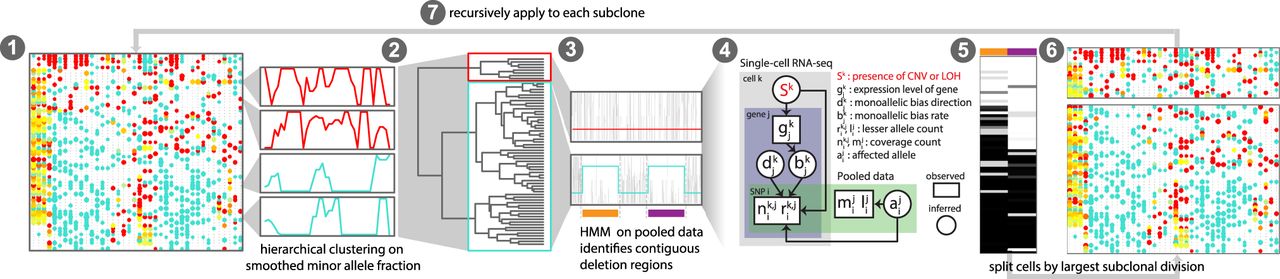
Overview of HoneyBADGER. CNVs and LOHs are identified from scRNA-seq data in the following seven steps: (1) Cells are first clustered on smoothed lesser-allele frequencies; (2) cells are split into two main groups and pooled; (3) a hidden Markov model on the pooled lesser-allele fraction identified regions with potential CNVs or LOHs; (4) a Bayesian hierarchical model assessed the posterior probability of a CNV or LOH for each region in each cell; (5) cells are clustered by their posterior probabilities of CNV or LOH for each region; (6) cells are split into putative subclones; and (7) the approach is recursively applied to each subclone until no new subclones can be detected.


