
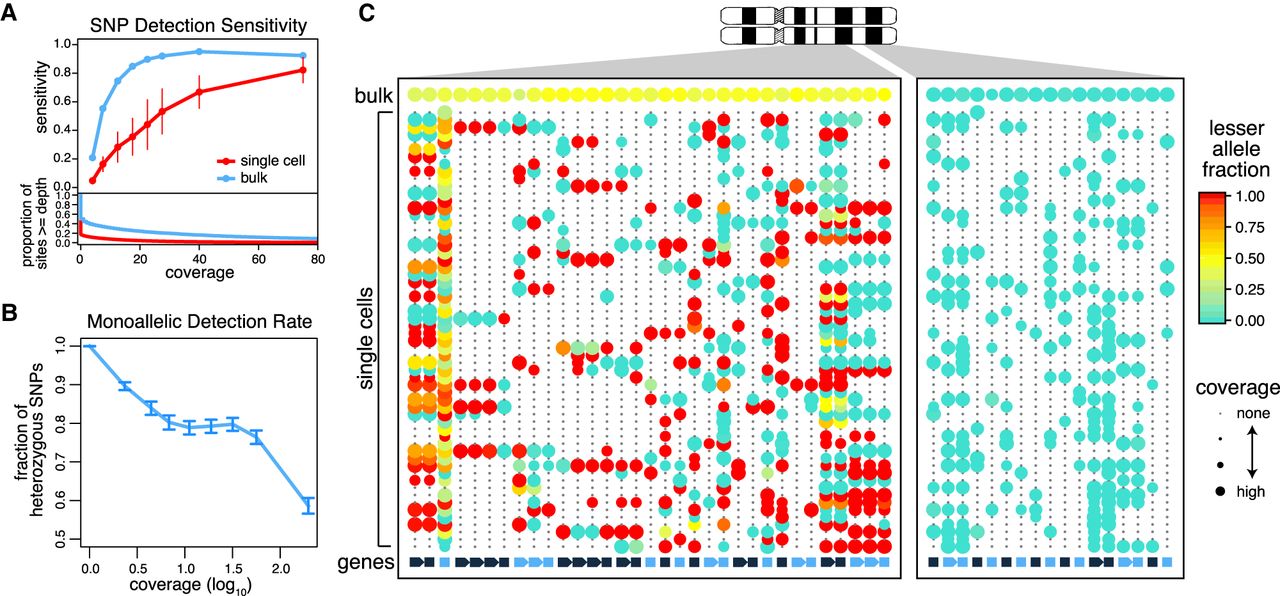
Prevalence of monoallelic detection and sparse signals in scRNA-seq data. (A) Sensitivity of heterozygous SNP detection as a function of coverage in single-cell and bulk RNA-seq data for the K562 cell line. Sensitivity was calculated as the proportion of sites that are called heterozygous in the RNA-seq sample among the sites that were called heterozygous in the WES data. Error bars, SD. The coverage distribution (bottom) is shown for bulk and an average of the individual cells. (B) Prevalence of monoallelic detection in scRNA-seq data. Lowly expressed genes are nearly exclusively detected in a monoallelic manner. The monoallelic detection rate generally goes down with expression magnitude; however, it remains high even for well-covered polymorphisms. Error bars, 95% confidence interval of the binomial proportions. (C) Lesser allele fraction profile visualizes patterns of allelic imbalance for germline heterozygous SNPs identified from scRNA-seq. The dot plot illustrates coverage (size) and allele bias (color) for germline heterozygous SNPs (rows) detected in different cells (columns). The bottom row designates genes with alternating color labels. Single cells commonly exhibit stretches of monoallelic detection within genes, as noted by the same color dots. However, across genes in a single cell, both alleles can be observed, suggesting that both alleles are present. In contrast, within a deletion region (right), single cells can only express from the nondeleted allele.


