
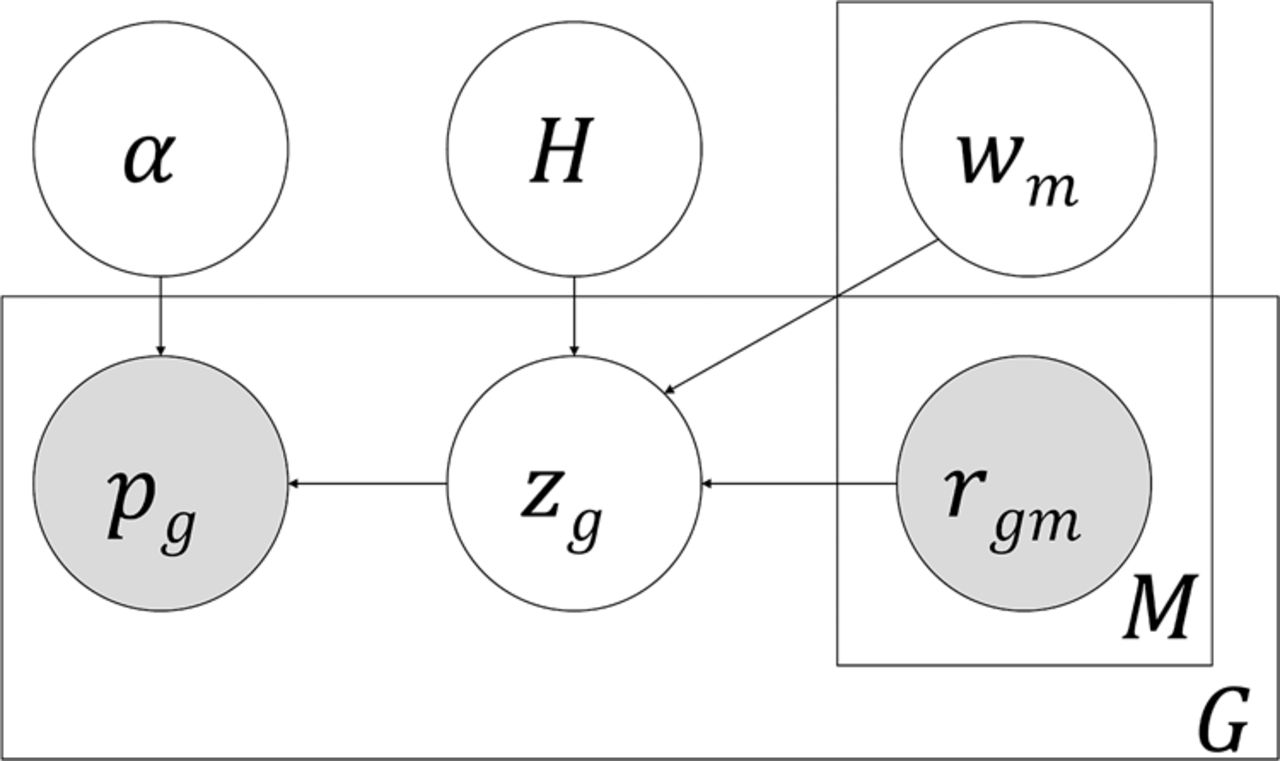
Plate diagram of pGENMi model. A latent variable zg represents whether a gene g mediates the influence of a TF on phenotype, and its enclosing rectangle denotes G such genes. pg denotes the TWAS P-value between the gene's expression and phenotype variation for each of the G genes. If zg = 1, we expect an enrichment for significant TWAS P-values, and pg is modeled by a Beta distribution parameterized by α; otherwise, pg is modeled as being distributed uniformly in [0,1]. We also observe one or more lines of evidence supporting the TF's influence on the expression of each gene g, such as the existence of a cis-eQTL within a ChIP peak of the TF near that gene. These “regulatory evidences” are denoted by the binary variables rgm, and there exist M such types of evidence (m = 1 … M), with relative weights wm. These evidences combine in a logistic function to determine Pr(zg = 1). The weights wm are learned over all genes, and as such, are shown outside of the rectangle enclosing G. The H variable indicates whether wm is free or restricted to zero (null model) for hypothesis testing (see “Probabilistic graphical model” section in Methods).


