
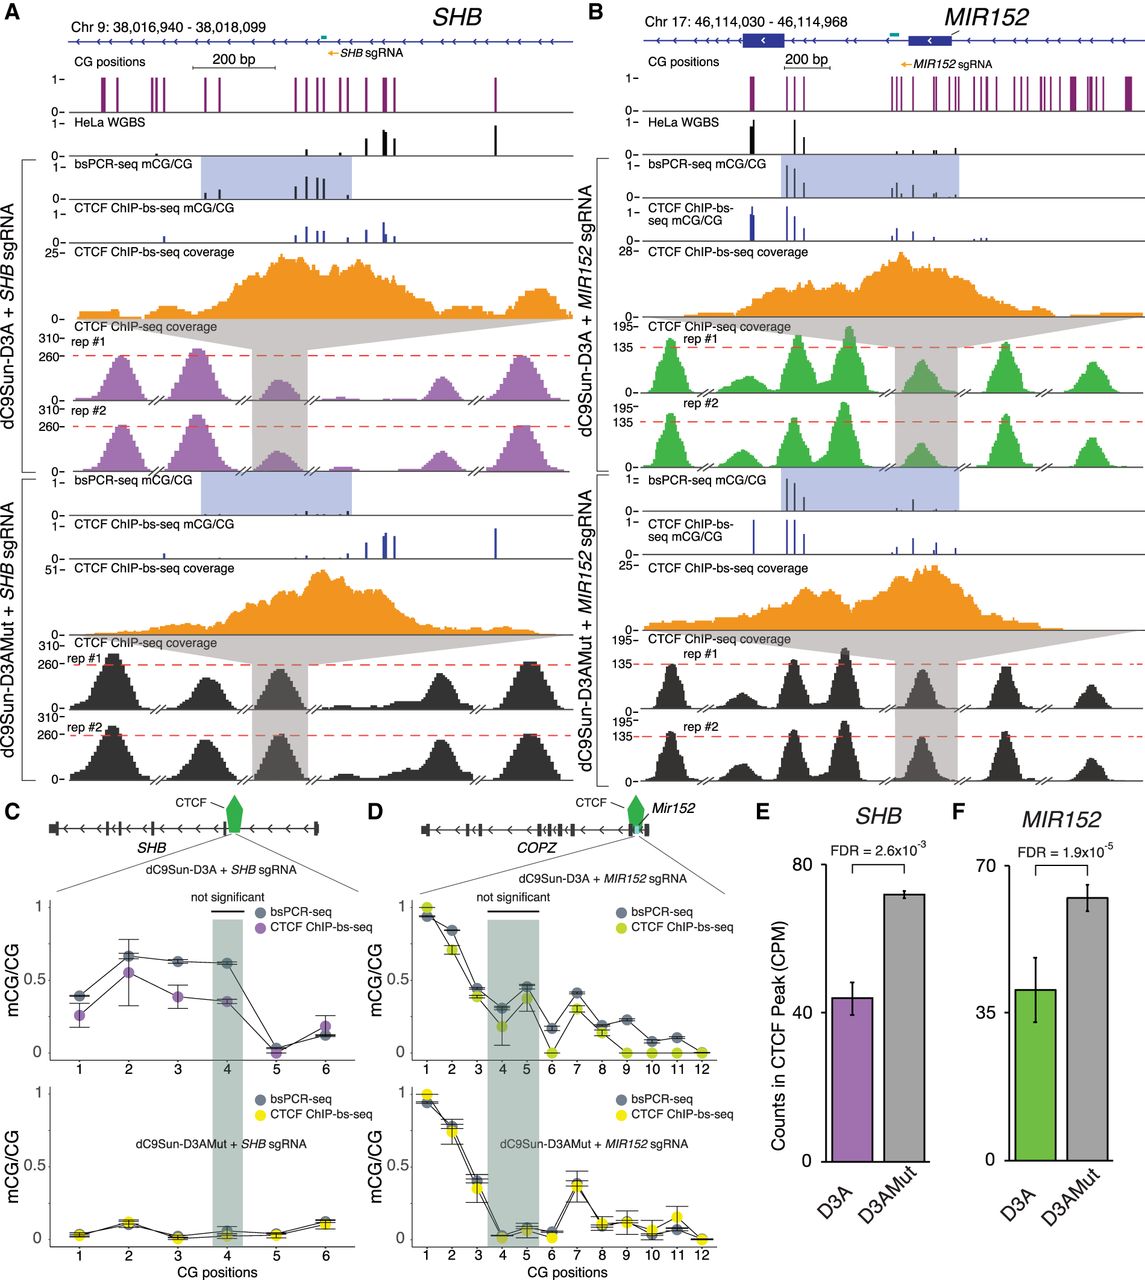
Impact of targeted DNA methylation induction on CTCF binding. (A) Genome Browser display of targeted CTCF binding site in an SHB intron. Sets of experiments include (from top to bottom): targeted bsPCR-seq (fraction mCG/CG), CTCF-ChIP-bs-seq (fraction mCG/CG), CTCF-ChIP-bs-seq coverage, and CTCF ChIP-seq coverage. CTCF core binding site is highlighted in shaded green. CTCF ChIP-seq coverage (TMM normalized counts) is shown with adjacent peaks for reference (broken x-axis). Red dotted line is set to maximum targeted CTCF peak in the control samples. (B) Genome Browser snapshot of targeted CTCF binding site upstream of MIR152. (C,D) Quantitation of mCG/CG in CTCF core binding site (green shaded region) and adjacent to core binding site comparing targeted bsPCR-seq (gray circles) to ChIP-bs-seq (purple or green circles for αGCN4-D3A and yellow circles for αGCN4-D3AMut) for SHB and MIR152, respectively (replicates n = 2; error bars, SD; Fisher's exact test). (E,F) Quantitation of CTCF CPM normalized ChIP-seq peak at SHB and MIR152, respectively (replicates n = 2; error bars, SD; statistic edgeR, Benjamini-Hochberg multiple test corrected P-values).


