
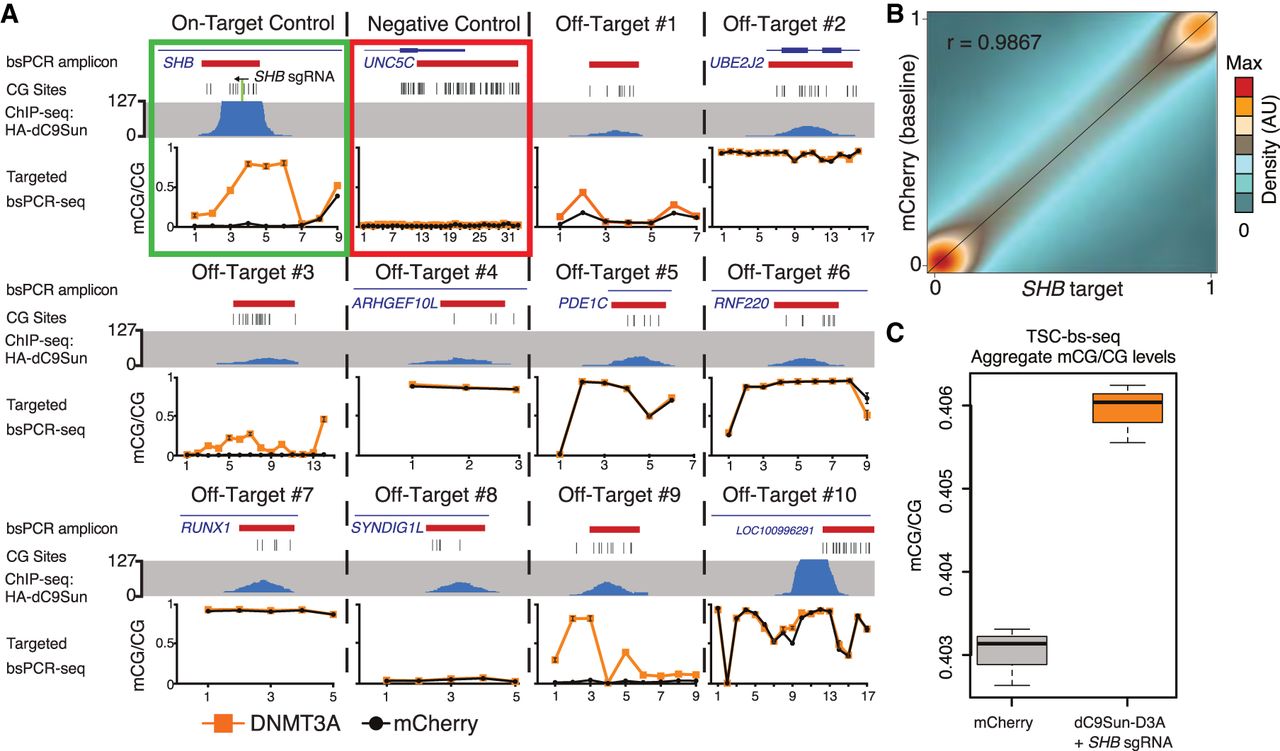
Genome-wide off-target DNA methylation assessment. (A) Compilation of dC9Sun-D3A ChIP-seq (blue peaks) and targeted bsPCR-seq for CGs covered by ChIP-seq (bsPCR amplicon location in red), bsPCR-seq mCherry-only expressing cells (black line), and SHB sgRNA + dC9Sun-D3A (orange line) (sorted cells, n = 3 biological replicates; error bars, SD). (B) Correlation of mCG values for each CG site (>2.6 × 10⁶, ≥5× coverage) of combined replicates (n = 3) from Illumina TruSeq methyl capture EPIC pulldown experiment. mCherry (baseline) HeLa cells shown on y-axis; SHB target dC9Sun-D3A HeLa cells shown on x-axis. Pearson correlation coefficient shown in upper left corner. (C) Boxplot of mCG/CG from all covered CGs from mCherry only HeLa cells (gray) and SHB sgRNA + dC9Sun-D3A (orange) (n = 3 biological replicates; thick black line indicates median; error bars, SD).


